As a manager with direct reports, you can view the Workforce Insights Manager dashboards in WX. The dashboards contain data from team members reporting to you, and their teams. You can filter how many levels you want to view.
To access the dashboards:
In the menu, select Workforce Insights. This process may be named differently in your organization:

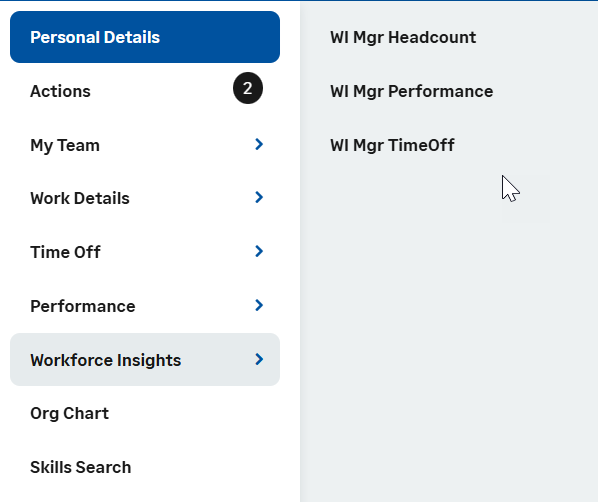
In the menu, select the service hosting Workforce Insights. In this example, the service is called Workforce Insights but it may be differently named in your organization. Then select a dashboard:
The Filters section displays the global filters that apply the selected filter to the entire dashboard:

-
Apply the Manager Name filter to all cards and charts in the dashboard. You can view all managers who report, directly, or indirectly, to the logged in user. This will include the user themselves. This filter supports single selection, is sorted alphabetically, and defaults to the first manager in the list.
-
Apply the Management level filter to all cards and charts in the dashboard. This filter determines how many levels down from you in the organization data is included. The options available in the filter depend on how many levels you have below you. The number of management levels available for each manager is calculated in the Workforce Insights data recipes.
-
Apply the Country filter to all cards and charts in the dashboard. You can use various operators to select the countries you want to include or exclude. The Country filter is based on the country of the Work Location selected in the Employment Record. A value of XXX is inserted for records with blank Work Location value.
- Apply the Department filter to all cards and charts in the dashboard. You can view a list of departments associated with team member records. The filter is dynamically scoped based on the selected manager in the Manager Name filter, showing only departments relevant to their reporting hierarchy. The filter supports multi-selection, is sorted alphabetically and defaults to All departments.
-
Apply the Employment type filter to all cards and charts in the dashboard. You can use various operators to select the countries you want to include or exclude. The filter is based on the values of the Basis field in the Employment Record, with the No Type value inserted for any records with blank values.
On the title bar on the right, you can view the date and time when the dashboard data was refreshed, and switch between high contrast view on and off (the default is off):

Dashboards
This section provides brief descriptions of the cards and charts in the dashboards, what key fields are used, and how the figures are calculated to give you a basic idea what the data is.
Headcount dashboard
-
Headcount section:
All cards and charts in the Headcount section consider active employees only. Active employees are those whose employment start date is today or earlier, and for whom Has Left in the Team Member record is false.
-
Headcount: Displays the number of active employees you have in the reporting line below you.
-
FT equivalent: Displays the number of active employees in your team as a full time equivalent (FTE) number. The FT equivalent card counts all the hours worked by the total number of employees and translates it into full time equivalents (FTE).
-
Actual FT: Displays the actual number of active full time employees. If all employees work full time, Actual FT and FT equivalent are the same.
-
Future leavers: Displays the number of currently active employees who have employment end dates entered, and the date is today or in the future.
-
Headcount by type of employment: Displays a donut chart with the proportion of different employment types in the headcount of active employees. Employment types are based on the values of the Basis field in the Employment Record. If you hover over a section of the chart, displays the employment type and the headcount for that type.
-
Headcount by country: Plotted on a map, displays the headcount of active employees for each country in your team. The chart uses the Country field in the Work Location object to determine an employee's country. If you hover over a country on the map, displays the name and three-letter ISO code of the country and the headcount for the country.
-
-
Tenure section:
All cards and dashboards in the Tenure section consider active employees only. Using the same definition as the Headcount section, active employees are those whose employment start date is today or earlier, and for whom Has Left in the Team Member record is false.
Average tenure in the Tenure cards and charts is calculated as the average of the sum of all the days worked for the organization to date by current active employees.
-
Average tenure: Displays the average tenure length as a number of years.
-
Tenure by country: Plotted on a map, displays the length of average tenure for currently active employees in a country in your team. Average tenure is calculated in the same as for the Average tenure card.
-
Tenure by type of employment: Displays a bar chart with the length of average tenure in years for active employees of each type of employment in your team. Employment types are based on the values of the Basis field in the Employment Record. Includes a line for average tenure length in your team.
-
Time Off dashboard
If your organization uses hours as the time off rate unit, hours are converted to days using a factor set in your organization's configuration, or if it not set, using the standard conversion formula of (absence duration in hours)*0.125. from the Y25.1 release, you can switch between viewing the Time Off dashboard cards and dashboards in days and in hours using the toggle. There are standard calculations for AbsenceHours and AbsenceDays in the recipes and the filter uses the same logic: if you have an org specific conversion factor between days and hours, it’s used. If not, the conversion assumes a day has 8 hours.
-
AbsenceDays: If the rate unit is hour, the calculation uses the Hours to Days Conversion Factor, if it is defined, and a standard conversion rate of 8 if it's not defined. The duration in the Days/Hours field is divided by the conversion factor if defined, and by 8 if not. If the rate unit is day, the duration from the Days/Hours field is used as-is.
-
AbsenceHours: If the rate unit is day and the Hours to Conversion Factor is not defined or zero, the duration in the Days/Hours field is multiplied by 8. If the rate unit is day and the Hours to Days Conversion Factor is defined, then the duration in the Days/Hours field is multiplied by the conversion factor.
-
Time off section:
All cards and charts in the Time Off section exclude employees for whom Has Left in the Team Member record is true.
-
On leave today: Displays the number of active employees who are on vacation or absent today, including all absence types and reasons, based on the absence record's start and end dates, and on the Is On Leave field in the Team Member records. Is On Leave is a formula, which considers Employment Status values defined by your organization to denote long term absences. If you organization has not specified such values, it considers standard values On Leave Paid, On Leave Unpaid and Laid Off to denote long term leave.
-
On long term absence: Displays the number of active employees on long term absences, based on the Is On Leave field in the Team Member records. Is On Leave is a formula, which considers Employment Status values defined by your organization to denote long term absences. If you organization has not specified such values, it considers standard values On Leave Paid, On Leave Unpaid and Laid Off to denote long term leave.
-
Carry over left: Displays the number of carry over days for Vacation type absences available for employees. If carry over has expired, displays 0. Calculated using data from the Accrual Balance object. Future dated absences are not considered in the calculates.
-
Total time off taken: Displays the total number of time off, including all absence types and reasons, taken by employees, calculated based on the data from the Accrual Balances object.
-
Vacation taken: Displays the percentage of the total amount of Vacation type absences taken by employees out of the total amount of Vacation type absence time available to them. The data is based on the Accrual Balances object.
-
Time off in lieu available: Displays the number of time off in lieu (TOIL) days available for employees to take as time off. The data is based on the Accrual Balances object and only considers Vacation type absences.
-
Requested or approved vacation vs available vacation: Displays a mirror bar chart, where the left bar chart displays the number of absence days for active employees which are either pending or approved for each manager, and the right bar chart displays the remaining vacation balance for active employees available for the manager's team up to today's date. The absence days includes all approved and pending Vacation type absence days, including any TOIL awarded, and excludes rejected absences. The remaining balance is based on the value of Year End Balance field from the Accrual Balance object.
The chart uses data from Absence records and Accrual Balance records.
-
Time off taken by reason: Displays a bar chart with the total number of time off taken for each absence reason in your org. Uses data from the Accrual balance object.
-
Absence days over time: Displays a chart of the absence day records over time. The data comes from Absence Day records. If you do not use absence day records in your organization, the chart will be blank with the text No results found. The chart has its own filter for the time period you want to view.
-
-
Cards, charts, and tables in the Team Health section are based the Absence Day Record object. If your organization does not use absence day records for reporting on absences, this section displays no data.
What is counted as sickness absence in the Team Health section depends on the Is Sickness Absence checkbox field in the Absence Accrual Rule object. This field was introduced in the Y24.2 release.
The Team Health section has its own Period filter. The filter defaults to current year, but you can use it to filter to other date ranges.
-
Sickness days taken: Displays the number of days taken as sickness absences for the time period determined by the period filter.
-
Absence days vs sickness days: Displays a line chart of the total number of absence days (all absence types and reasons) and a column chart of the total number of sickness days in the time period determined by the period filter. Time off in lieu (TOIL) logged with negative absence duration is excluded from the absence days calculation.
-
Bradford score per team member: Displays a table with the Bradford score, number of sickness absences, and sickness absence duration for each employee in the time period determined by the period filter. The Bradford score is calculated by multiplying the absence duration by the square of the number of absences: Duration*(Number of absences^2).
-
Sickness days by country: Displays the total number of sickness absence days plotted on a map. Countries on the map are based on the Work Location countries.
-
Performance dashboard
-
Performance reviews section:
All cards and charts in the Performance reviews section exclude employees for whom Has Left in the Team Member record is true. Performance reviews in the Draft status are excluded.
-
Reviews due in next 30 days: Displays the number of performance reviews due in the next 30 days. Displays 0 if none are due in the next 30 days. Includes any performance reviews where the status is not Completed, and where the review's Period End Date is within the next 30 days of today.
-
Reviews completed in past 30 days: Displays the number of performance reviews completed in the past 30 days. Displays 0 if none were completed in the last 30 days. Includes any performance reviews where the status is Completed, and where the review's Signed Date is within the past 30 days.
-
Reviews completion date: Displays the percentage of performance reviews completed in the past 365 days out of performance reviews in all states where the review's Period End Date is in the past 365 days.
-
Reviews overdue: Displays the number of performance reviews where the review's Period End Date is within the last 365 days and the review's Status is not Completed.
-
Performance ratings curve: Displays the distribution of performance review ratings for performance reviews in the Completed status with the review's Period End Date in the past 365 days. Only ratings with values are included.
-
Performance score by country: Plotted on a map, displays the average performance review rating scores for performance reviews in the Completed status and the review's Period Start Date and Period End Date in the past 365 days for each country. Countries are based on the Country field in the Work Location object.
-
Performance reviews vs salary increase: Displays a mirror bar chart, where the left bar chart displays the performance review rating score for each employee and the right bar chart average salary increase percentage. Only performance reviews in the Completed status and with the the Period End Date in the past 365 days are included. For the salary increase, the chart uses the Increase Percentage formula field in the employee's current Salary record, and only considers current Salary records with a start date in the current year.
-
-
Objectives section:
The Objectives section draws data from the Enhanced Objective object. All cards and charts in the Objectives section exclude employees for whom Has Left in the Team Member record is true. Group objectives for groups where the employee is a member are excluded.
-
With objectives: Displays the number of employees with active objectives.
-
Without objectives: Displays the number of employees without active objectives. If an employee's objectives are in the Draft status or closed, the employee is counted as being without objectives.
-
Active: Displays the number of active objectives. Includes objectives in the Active status and with the objective Start Date in the current year.
-
Closed: Displays the number of closed objectives. Includes objectives in the Closed status and with the objective Closed Date in the current year.
-
Review overdue: Displays the number of active objectives with reviews overdue. Objective reviews are overdue if the review date for the objective is in the past, and the objective is in the Active status.
-
Review due in 30 days: Displays the number of active objectives where the next review date in the objective is within the next 30 days from today.
-
Completion rate: Displays the percentage of objectives that are completed, out of the total number of currently active and closed objectives. Includes objectives in the Active status with the Start Date in the current year, and objectives in the Closed status with the Closed Date in the current year.
-
Active vs closed objectives by manager: Displays a mirror bar chart for each in your team, where the left bar chart displays the number of active objectives by manager and the right bar chart the number of closed objectives. Includes objectives in the Active status with the Start Date in the current year, and objectives in the Closed status with the Closed Date in the current year.
-
Objectives status: Displays a donut chart of objective status: Active or Closed. Includes objectives in the Active status with the Start Date in the current year, and objectives in the Closed status with the Closed Date in the current year.
-
Completed objectives over time: Displays the distribution of closed objectives over time. The chart has its own filter for the time period you want to view. The filter defaults to Current Year.
-
-
The cards and charts in the Feedback section use data from Feedback Request, Feedback Provider and Feedback Response objects in the Performance Management package. All cards and charts in the Feedback section exclude feedback requests for employees (as the Subject of a request) for whom Has Left in the Team Member record is true. The cards include feedback responses where the Author of the response has left but the subject of the feedback request is an active employee.
-
Feedback requests completed: Displays the number of completed feedback requests. A feedback request is defined as completed if the number of feedback providers linked to the record matches the number of linked feedback responses.
-
Feedback requests open: Displays the number of feedback requests in progress. A feedback request is defined to be in progress if the number of linked feedback responses does not match the number of linked feedback providers.
-
Feedback received % employees: Displays the percentage of completed feedback requests out of the total number of feedback requests (open and completed). The card uses the same definitions for completed and open requests as the Feedback requests completed and Feedback requests open cards.
-
Feedback requested vs feedback received: Displays a bar chart with the number of feedback providers linked to feedback requests and the number of feedback responses linked to feedback requests for each employee where the employee is the subject of the request.
-
Feedback requests received vs feedback given: Displays a bar chart with the number of feedback responses where the employee is the subject and the number of feedback provider records where the employee is the author of the response for each employee.
-
View details for dashboards
Dashboard sections display a View details button. Select View details to view summary tables:

If you select an area of the dashboard, the table updates to display values for the selection.
Select Go Back to return to the main dashboard.