WX reports can be made accessible to managers and team members through the WX menu. Reports can be displayed as WX processes in any WX service. This example shows an Analytics service that hosts reports showing information about your your team:
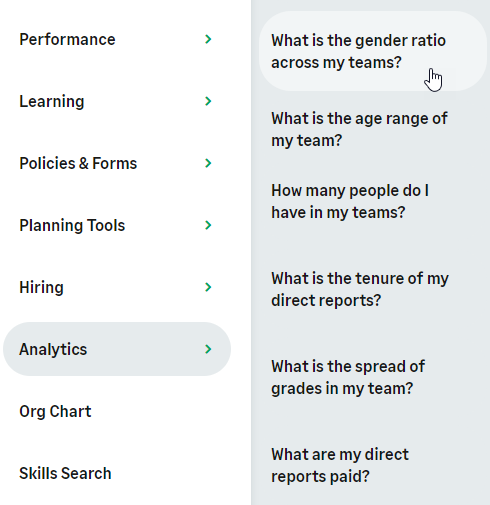
Select the report name to display the report in the defined default format. WX reports without a default format, or with a default format that cannot be used, display in table format:
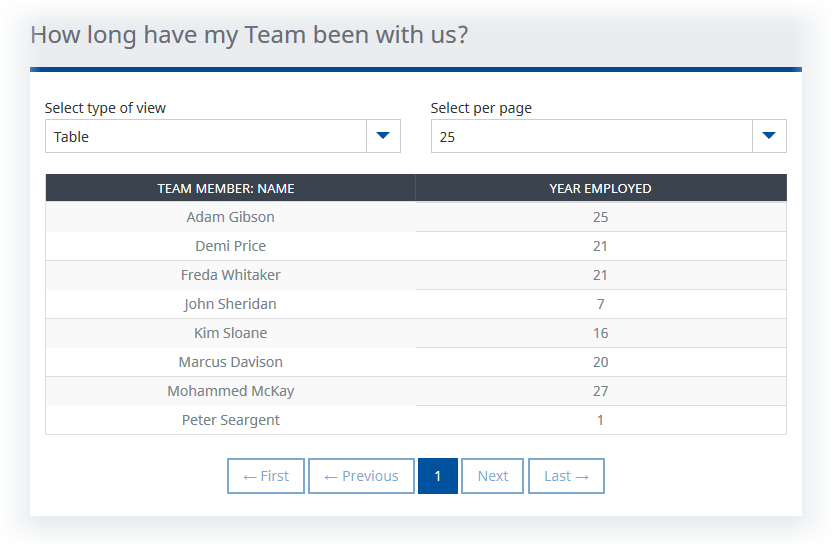
Table format:
- Includes all columns in the underlying Report, in the left to right order they have in the Report.
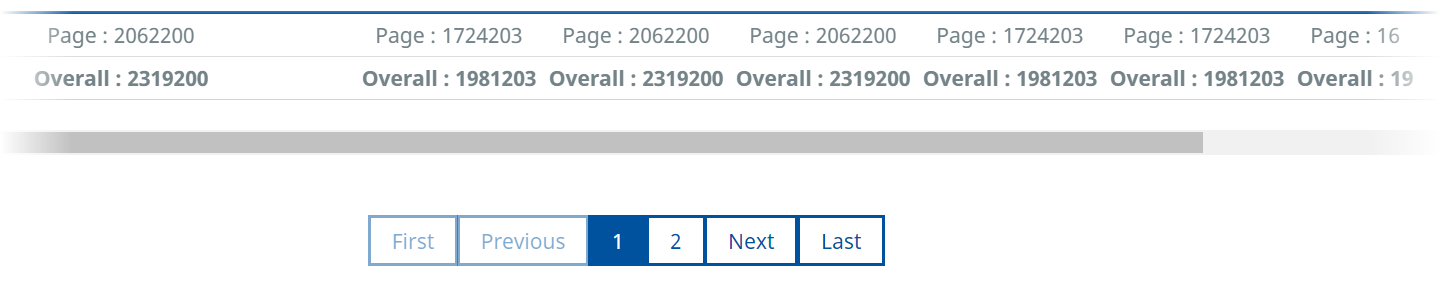
- Multi-page tables that include totaled numeric values show Page Totals and an Overall Total.

-
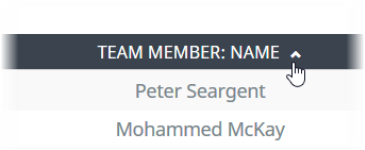
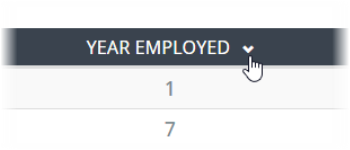
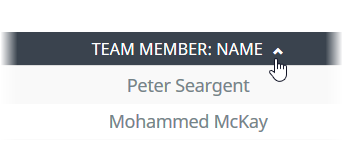
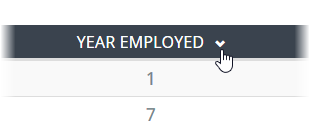
Sort order is determined by that used in the underlying report. You can change sort order by selecting a column header in WX:
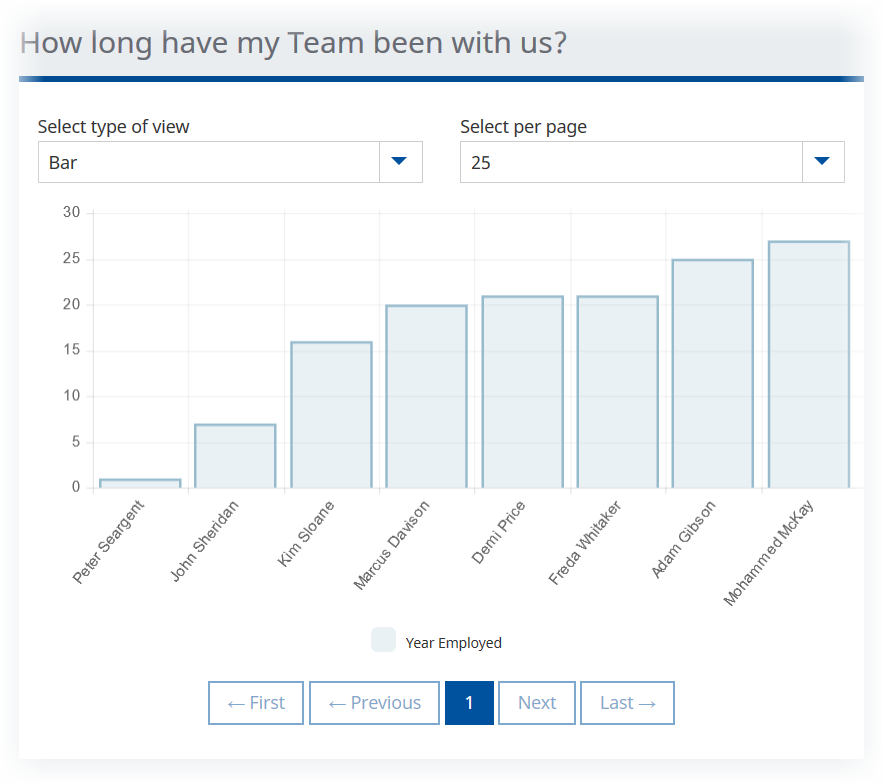
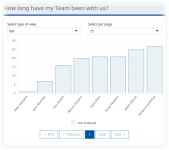
To change the view, use the Select type of view picklist:
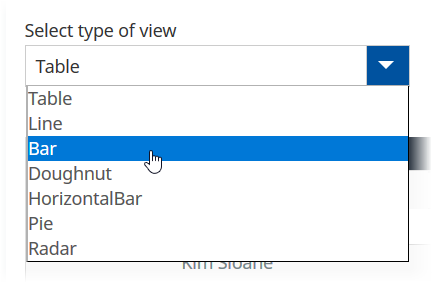
- All chart types use the column order and sort order displayed in Table format.
-
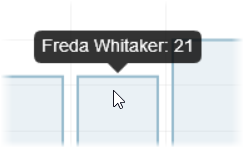
To display detail on a chart element, hover on the element:
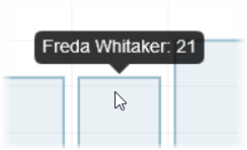
-
For Reports containing larger amounts of data, control the number of data points with the Select per page picklist:
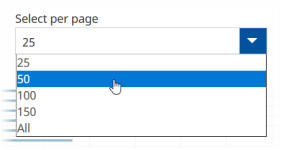
-
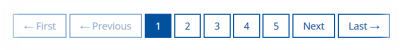
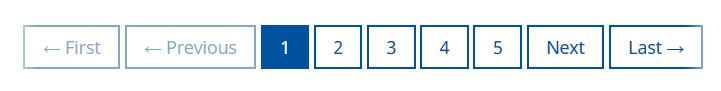
For multi-page displays, use the page navigation controls to move through the pages: