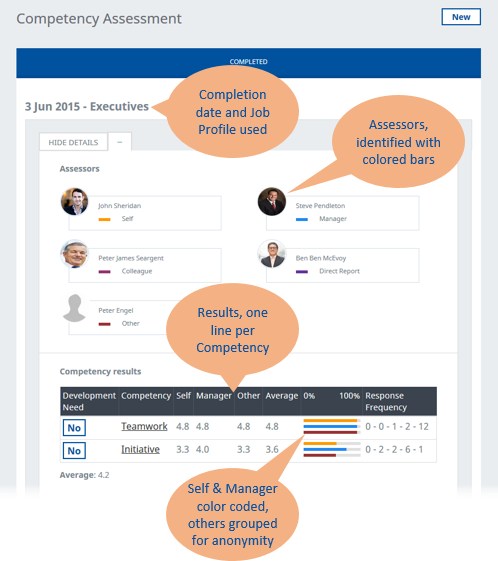
For completed assessments, results are displayed on the Team Members Competency Assessment Process Detail view. The view identifies:
-
the completion date and the Job Profile used in the assessment
-
the assessors. Assessors are identified with differently colored bars. The subject of the competency assessment (Self) and their manager are identified in the results, other assessors are grouped for anonymity.
-
the results for each competency, one competency per line.

Competency results section
Competencies used for the assessment, ranked in descending order by overall average score of all assessments except the self assessment.
-
Scores for:
-
Self
-
Manager
-
The average for Other assessors
-
The Average for Manager and Other, excluding the Self score.
-
-
Response frequency.
Shows the frequency of scoring for the indicators underlying each competency. Excludes scoring on the Self Assessment. For example, for the competency Initiative:
-
There are three indicators, each of which can be scored from 1 to 5.
- The Response frequency column shows 0-2-2-6-1, with each number showing the total number of responses for each possible score.
- 0 indicates no responses for that score, so none of the three indicators were scored 1 by any of the assessors.
- 2 indicates that across four assessors and three indicators, 2 were scored 2, 2 were scored 3,
- 6 indicates that across four assessors and three indicators, 6 were scored 4.
- 1 indicates that across four assessors and three indicators, 1 was scored 5.
-
Analysis of the results
Based on the results, Sage People calculates:
- The average self score across all indicators.
- The average score by manager and others across all indicators.
- The mid-points of the two averages, for self and others.
- The positions of all scores for self and others above and below their respective mid-points.
- The magnitude of the difference between each score and the mid-point.
The five scores that are furthest from the averages, both above and below, are then compared, self to other. This enables classification into one of four groups:
- High:High
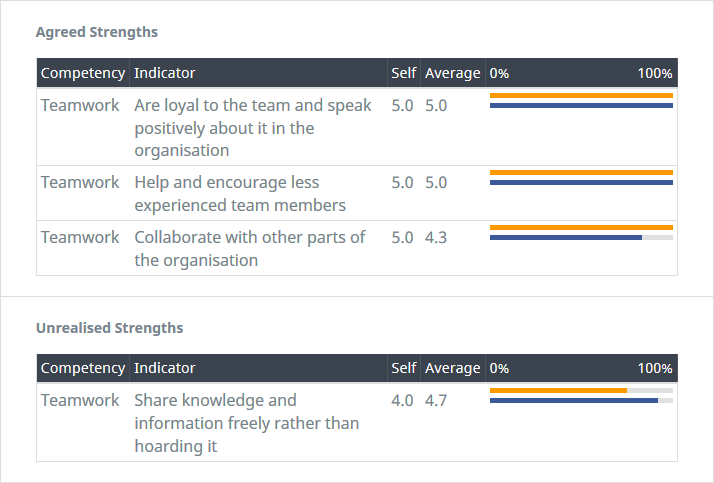
Self and Other scores are both above their respective mid-points. These are Agreed Strengths.
- Low:High
Self score is below the self mid-point, Other score is above the Other mid-point. These are Unrealised Strengths.
- Low:Low
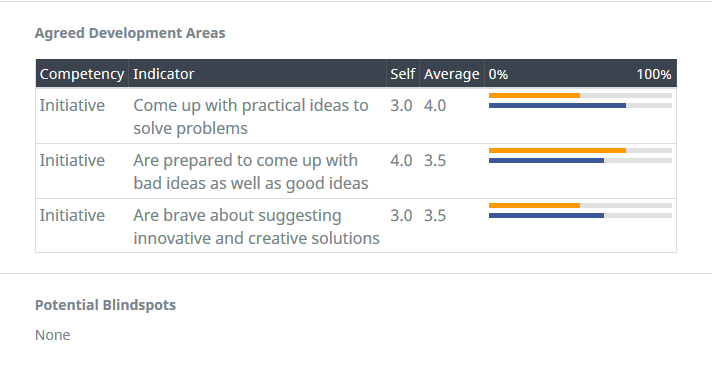
Self and Other scores are both below their respective mid-points. These are Agreed Development Areas.
- High:Low
Self score is above the self mid-point, Other score is below the Other mid-point. These are Potential Blindspots.
- High:High
- Results display up to five Indicators and their associated Competencies for each of the four groups.
- Depending on the distribution of the results, up to two groups may be empty.
- Results are calculated and presented for each Team Member. It is not valid to compare strengths and development areas for different Team Members.


Agreed Strengths
When Self and Other scores are both above their respective mid-points, the analysis identifies Agreed Strengths.
- High scored indicators for which there is good correlation between the self score and the average score by all other assessors. Ranked in descending order by overall average score of all assessments except the self assessment.
- Competencies to which the indicators contribute.
Unrealised Strengths
When the Self score is below the self mid-point, and the Other score is above the Other mid-point, the analysis identifies Unrealised Strengths.
- Indicators for which the self score is well below the average score by all other assessors. Ranked in descending order by overall average score of all assessments except the self assessment.
- Competencies to which the indicators contribute.
Agreed Development Areas
When the Self and Other scores are both below their respective mid-points, the analysis identifies Agreed Development Areas.
- Low scored indicators for which there is good correlation between the self score and the average score by all other assessors. Ranked in descending order by overall average score of all assessments except the self assessment.
- Competencies to which the indicators contribute.
Potential Blindspots
When the Self score is above the self mid-point, and the Other score is below the Other mid-point the analysis identifies Potential Blind spots.
- Indicators for which the self score is well above the average score by all other assessors. Ranked in ascending order by overall average score of all assessments except the self assessment.
- Competencies to which the indicators contribute.