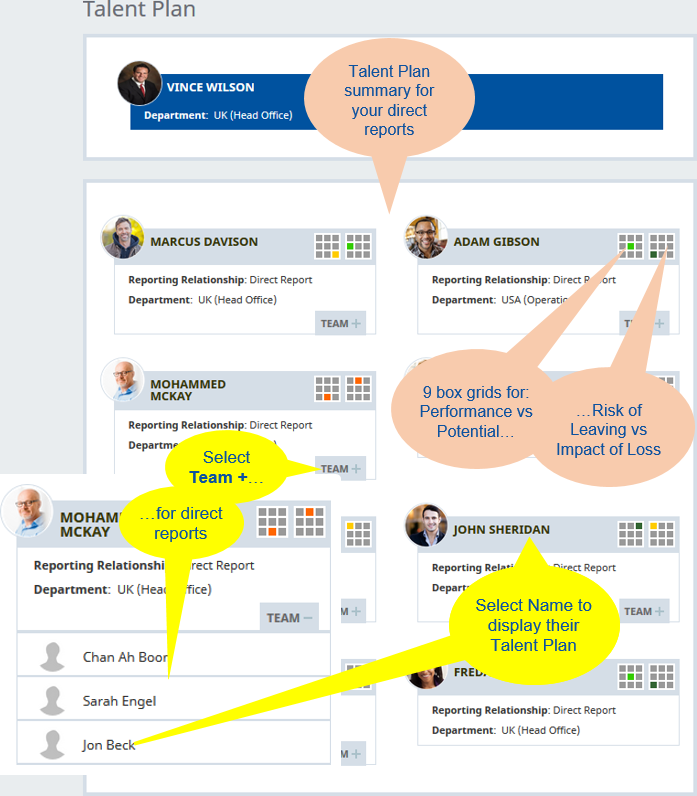
The Talent Plan Org Chart view displays the Talent Plan summary for your direct reports. The grids next to a team member's name indicate where the team member sits on the grid for Performance vs. Potential (grid on the left) and for Risk of Leaving vs. Impact of Loss (grid on the right).
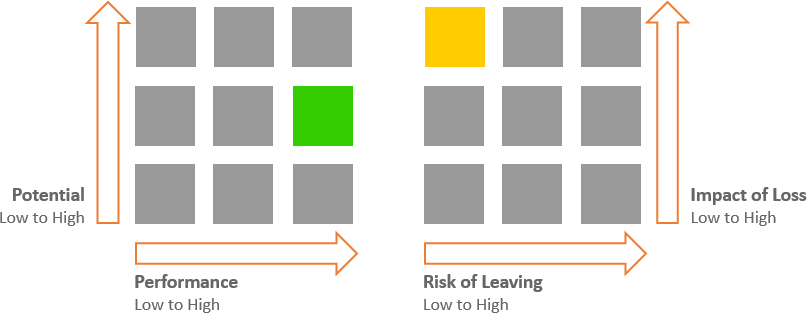
Two 9-box grids using colored tiles to represent the ratings for the Team Member, the left grid for performance against potential, the right grid for risk of leaving against impact of loss:

When there are more than three ratings for Potential, Performance, Risk of Leaving, or Impact of Loss, scores are normalized to enable their display in a 9-box grid.
For more details on the Performance vs. Potential grid, see 9 box grid view.
The Risk of Leaving vs. Impact of Loss grid is only displayed on the Talent Plan Org Chart view. It displays the Risk of Leaving on the X axis and the Impact of Loss on the Y axis. By default both are expressed on a Low-Medium-High scale:
-
A team member whose Risk of Leaving is Low and Impact of Loss is High has the dot in the top left corner of the grid.
-
A team member whose Risk of Leaving is High and Impact of Loss is Low has the dot in the bottom right corner of the grid.
To view talent plans for the direct reports of your direct reports, select Team + and then select the team member's name.

To display the talent plan for one of your direct reports, select their name on the Talent Plan Org Chart display:

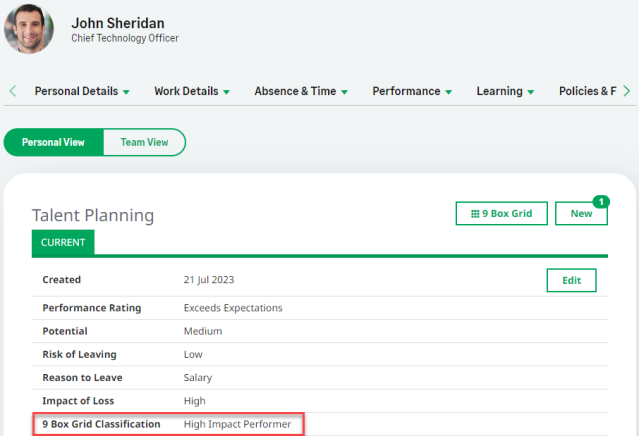
WX displays the Talent Plan detail view for the team member you selected. If your administrator has enabled Talent Plan 9 Box Grid, the Detail view includes the 9 Box Grid Classification.
