
Select Edit Report to modify the information included in the report. Editing a report allows you to:
-
Modify row and column groupings
-
Add, remove or rearrange columns
-
Add, change, or remove filters
On the Edit Report screen:
Use the Outline tab to change the fields you want to include in the report. Group information by rows or columns.
Use the Filters tab to add or remove filters, and set the default value of filters. You can also define filter logic, and add cross filters to apply filters across related objects.
The preview panel displays a view of the report as you make changes. Use the Run button to preview the report using your organization's live data.
Add further fields to the report using Add Columns.
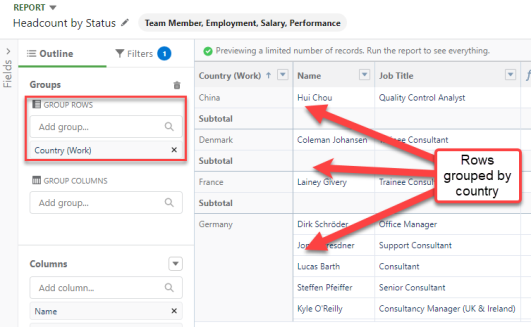
Use Group Rows to group records in the report by matching values in the Group Rows field you select.
For example, to group Team Members by country, add Country (Work) to the Group Rows field. Team Members in each country status will be grouped on the y-axis. In the example shown, we can quickly see that there is a single employee in China, Denmark, and France, while Germany has multiple employees.
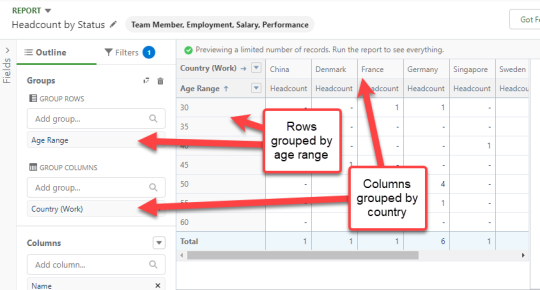
If you have an entry for Group Rows, you can also use Group Columns to further group information in your report along the x-axis to create a matrix report (sometimes known as a pivot table). Grouping by columns creates a new column in the report for each value in the grouped field. Matrix reports are away of summarizing large amounts of data in a grid. For example, use a matrix report to compare values by two different categories of information.
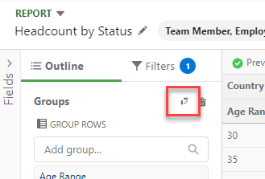
To quickly pivot the matrix report, use the Swap Rows and Columns button.