Pay gap analysis is applied to the difference in earnings between groups of workers employed by an organization. It can be applied to groups defined by ethnicity, gender, or some other classification. Pay gap reporting is a legislative requirement in some countries and economic sectors, and is increasingly seen as a desirable form of disclosure for publicly quoted companies. In the UK, public, private, and voluntary sector organizations with 250 or more employees are required to report annually on their gender pay gap - the difference in average pay between men and women, typically expressed as a percentage.
Data stored in your Sage People system can be used to prepare indicative pay gap analysis for internal use, and can help identify areas for further investigation. To meet legislative reporting requirements you must use definitive data supplied with the help of your organization's payroll provider.
This example tells you how to create a range of reports for gender pay gap analysis:
-
Two salary reports, requiring a new salary history custom report type:
-
Gender pay gap based on annual salary.
-
Gender pay gap based on hourly rates of pay.
Requires a new formula field to calculate the hourly rate of pay.
-
-
A total remuneration report showing the gender pay gap using salary and projected bonus data.
-
Male pay against performance.
-
Female pay against performance.
-
Percentage difference in pay between male and female.
Includes creating formulas within the report to calculate difference in value and percentage difference.
-
Gender pay disparity
Includes creating a cross block summary formula within the report.
The example covers the creation of all required additional formulas and the new report type.
The example also tells you how to create a dashboard to host and display the underlying report data.
To take full advantage of the reporting examples your org must be using Sage People to provide team member, employment, and salary data, and to provide performance monitoring.
Create a new report type
To enable you to create the reports using salary history and related data you must first create a new custom report type.
Follow the instructions to create a new custom report type using the following information:
-
Complete the fields in Step 1 Define the Custom Report Type as follows:
Field What to enter Primary Object Salary History
Report Type Label Salary History
Report Type Name Salary History
Description Report type to support gender pay gap analysis
Store in Category Employees
Deployment Status Deployed
-
Select Next.
-
In Step 2 Define Reports Record Set leave the primary object as Salary History.
-
Select Save.
Sage People displays the summary page for the new custom report type.
-
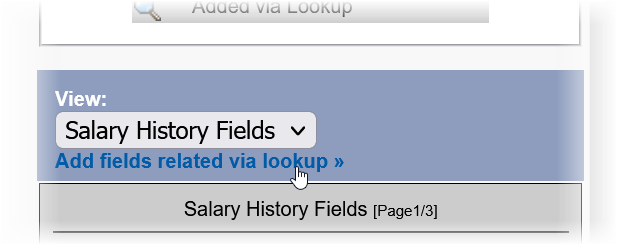
In the Fields Available for Reports section select Edit Layout
Sage People displays the Edit Custom Report Type page with the fields from the Salary History object listed in the Field Layout Properties section.
-
On the right of the page select Add fields related via lookup:
-
In the dialog select Employment to display the fields in the Employment Record object, then choose Select All.
-
Scroll down the list of selected fields and beside Team Member select view related fields:
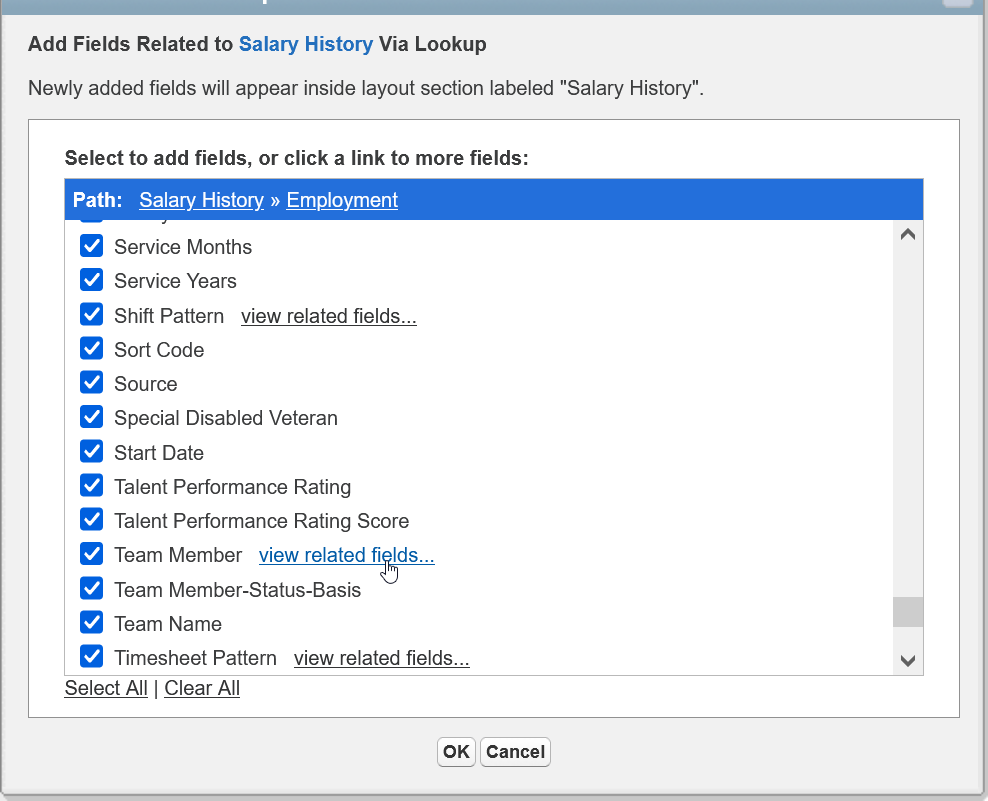
-
In the displayed list of Team Member fields choose Select All then select OK.
-
Select Save.
The Salary History custom report type is now available to use.
Create new formula fields
The reports in this example use a range of new formula fields to extract and display the data. You can create the formulas needed as part of creating each individual report, or you can create all the formula fields in advance and then call on them when you create each report .
Creating a formula field starts with these steps:
-
Go to Setup and select the Object Manager tab.
-
In Quick Find enter employment and select the label for Employment Record.
-
On the Employment Record page select Fields & Relationships.
-
On the Fields & Relationships page select New.
-
In Step 1 Choose the field type select Formula and then select Next.
Now follow the instructions for the individual formulas.
-
In Step 2 Choose output type:
-
In Field Label enter Hourly rate.
-
In Formula Return Type select Currency.
-
Leave the Options set at 2 decimal places.
-
Select Next.
-
-
In Step 3 Enter formula:
-
If your organization works a 40 hour week enter the following formula:
Copy
fHCM2__Current_Salary__r.fHCM2__FTE_Amount_Reporting__c/2080
-
If your organization works a 35 hour week enter the following formula:
Copy
fHCM2__Current_Salary__r.fHCM2__FTE_Amount_Reporting__c/1820
You can adjust the formula for different working week lengths by setting the number value to:
(the number of hours in the working week) x (the number of weeks in the year).
-
-
Select Check Syntax to help ensure you have entered a valid formula.
-
Enter a description and help text such as:
Calculates and returns a currency value for the hourly rate of pay based on a 40 hour working week.
Help text is displayed on detail and edit pages when a user hovers over the information icon next to the field.
-
In Blank Field Handling select Treat blank fields as blanks.
-
Select Next.
-
In Step 4 Establish field-level security, deselect all checkboxes in the Visible column and then select just those profiles you want to have edit access to the field.
Typically, optimize security by selecting as few profiles as possible but always include System Administrator and typically Fairsail Administrator or the custom equivalent defined for your Sage People org.
-
Select Next.
-
In Step 5 Add to page layouts accept the default selections and then select Save.
The Hourly rate formula field is created and can be used for reporting.
-
In Step 2 Choose output type:
-
In Field Label enter Hourly rate quartile.
-
In Formula Return Type select Text.
-
Select Next.
-
-
In Step 3 Enter formula, substitute the quartile point values from your org in the following formula:
Copy
IF(Hourly_rate__c < first quartile point value, "Q1",
IF(Hourly_rate__c < second quartile point value, "Q2",
IF(Hourly_rate__c < third quartile point value, "Q3",
IF(Hourly_rate__c >= third quartile point value, "Q4","NA"))))
Using the values from our example:
Copy
IF(Hourly_rate__c < 15.38, "Q1",
IF(Hourly_rate__c < 20.33, "Q2",
IF(Hourly_rate__c < 26.57, "Q3",
IF(Hourly_rate__c >= 26.57, "Q4","NA")))) -
Select Check Syntax to help ensure you have entered a valid formula.
-
Enter a description and help text such as:
Assigns hourly rates to one of four quartiles.
Help text is displayed on detail and edit pages when a user hovers over the information icon next to the field.
-
In Blank Field Handling select Treat blank fields as zeroes.
Blank Field Handling is displayed when you select the Advanced Formula tab. If you have created the formula using the Simple Formula tab you can switch to Advanced Formula to define how blank field are treated.
-
Select Next.
-
In Step 4 Establish field-level security, deselect all checkboxes in the Visible column and then select just those profiles you want to have edit access to the field.
Typically, optimize security by selecting as few profiles as possible but always include System Administrator and typically Fairsail Administrator or the custom equivalent defined for your Sage People org.
-
Select Next.
-
In Step 5 Add to page layouts accept the default selections and then select Save.
The Hourly rate quartile formula field is created and can be used for reporting. You can also add the field to the hourly rate list view:
Annually revisit the values used for the hourly rate quartile formula to ensure they align with current rates.
Define quartiles for hourly rates
Pay gap analysis gives more useful results when rates of pay are divided into bands, with the highest rates in the top band and the lowest in the bottom band. For this example, hourly rates are assigned to one of four quartiles. The highest rates are assigned to the top quartile, and lowest rates to the bottom. Defined quartiles are used to support an hourly rate quartile formula.
To define quartiles:
-
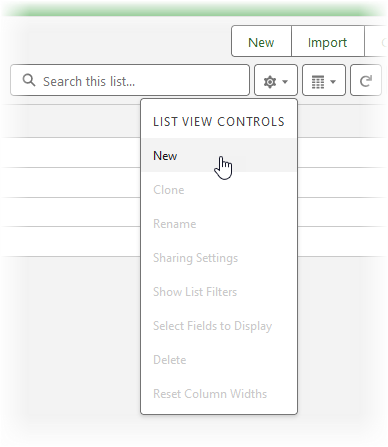
Go to the App Launcher and select Employment History.
-
On the Employment History list view select the List view controls picklist and choose New:
-
In the New List View dialog:
-
Enter a name for the list view such as Hourly rate.
-
Select the radio button to set who can see the list view.
-
-
Select Save.
-
In the Filters panel on the right of the page:
-
Select Filter by Owner and choose All employment history:
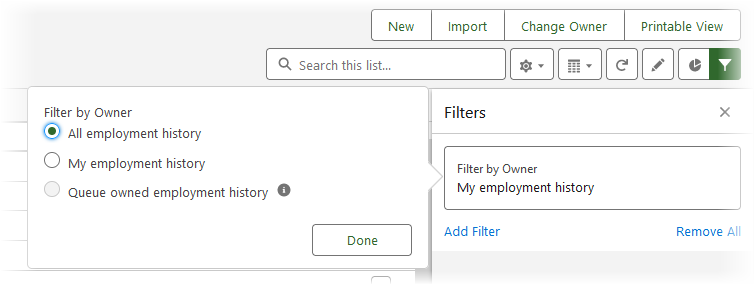
-
Select Done.
-
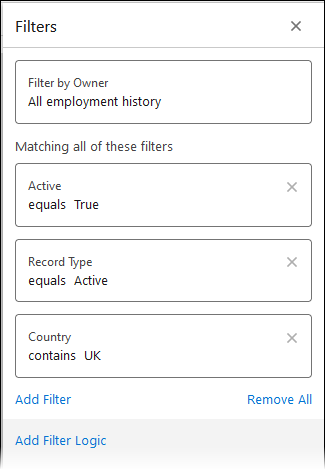
Select Add Filter.
-
Select the Active field, operator equals, value True.
-
Select Done.
-
Select Add Filter.
-
Select the Record Type field. operator equals, value Active.
-
Select Done.
-
To limit the report to a specific country, add a filter for the Country field. Set the operator to contains, and the value to the country name used in your org, for example UK. Select Done.
-
Select Save.
-
-
Select the List view controls picklist and choose Select Fields to Display.
-
In the Select Fields to Display dialog in the list of Available fields select Hourly rate and the chevron > to move it to the list of Visible Fields.
Add any other fields you want to display on the list view to give it context. For example, Team Member, Gender, Start Date.
-
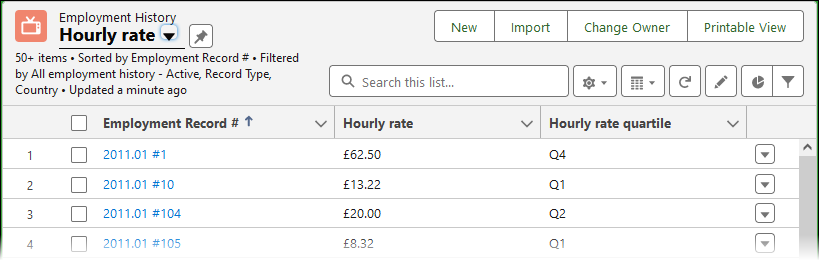
Select Save.
The list view updates to include an Hourly rate column.
-
Select the Hourly rate column heading to sort by hourly rate values.
-
Scroll to the bottom of the list and note the number of values, using the record counter at the left of the page:
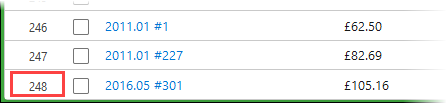
-
Divide the number by 4 to find the number of hourly rate records to include in each quartile. In this example with 248 records, each quartile contains 248 / 4 = 62 records.
-
Find and record the hourly rate for each quartile point. In this example:
-
Record 62 value = 15.38
-
Record 124 value = 20.33
-
Record 186 value = 26.57
-
You can now use the quartile point values to create the hourly rate quartile formula field.
Create reports
Creating a report starts with these steps:
-
Select the App Launcher, search for and select Reports.
-
On the Reports page select New Report.
-
On the Create Report dialog under Category select All.
Now follow the instructions for the individual reports.
These two reports have many steps in common to set them up. Where there are differences we use tables to show the steps for the report based on annual salary and those for the report based on hourly rates.
-
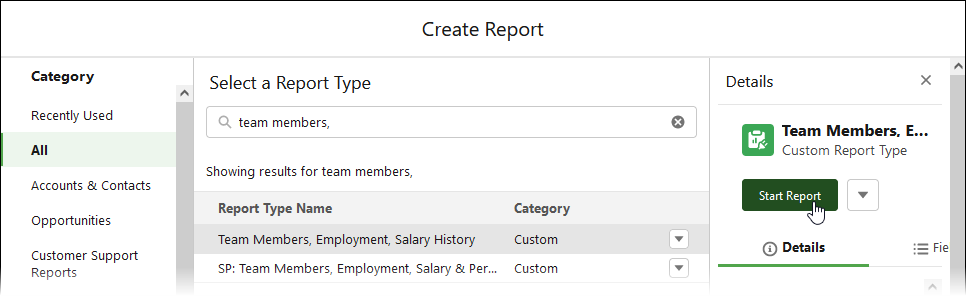
In Search Report Types enter Team Members, employment to filter the display of available report types.
-
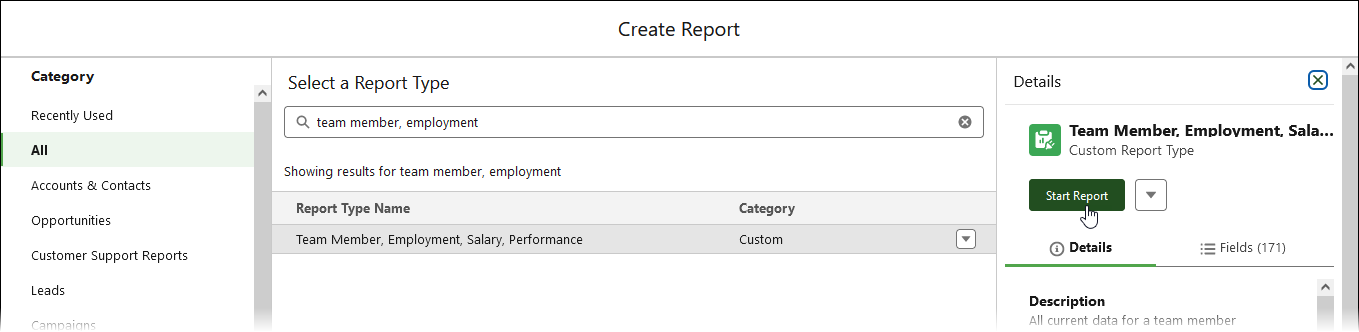
From the display of report types select Team Members, Employment, Salary History then select Start Report:
-
On the New Report page select the Filters pane.
-
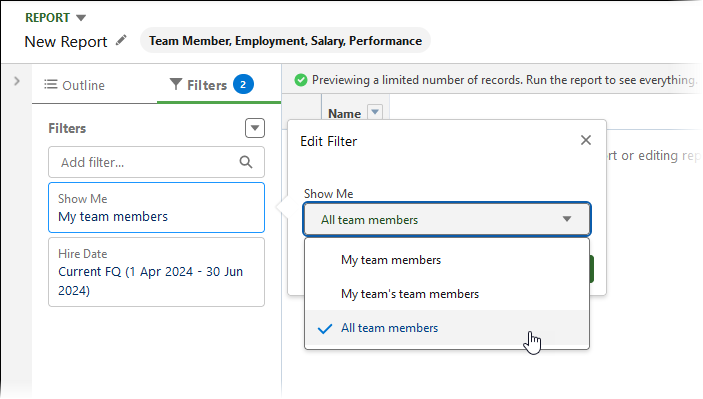
Select Show Me and choose All team members:
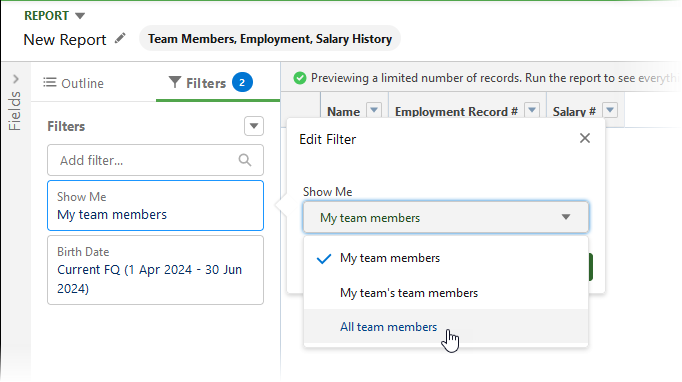
-
Select Apply.
-
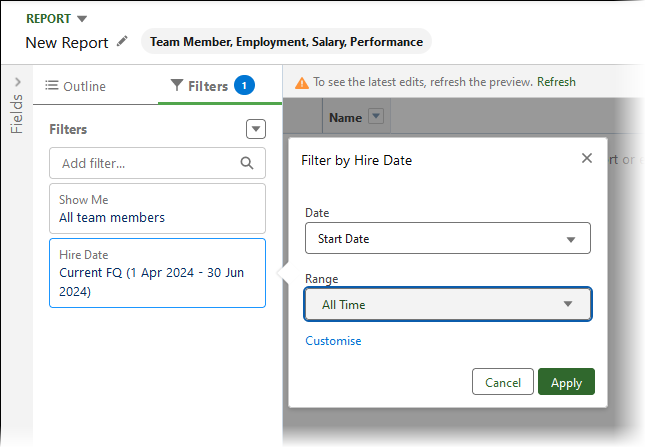
Select the date filter, choose Start Date and set the Range to All Time:
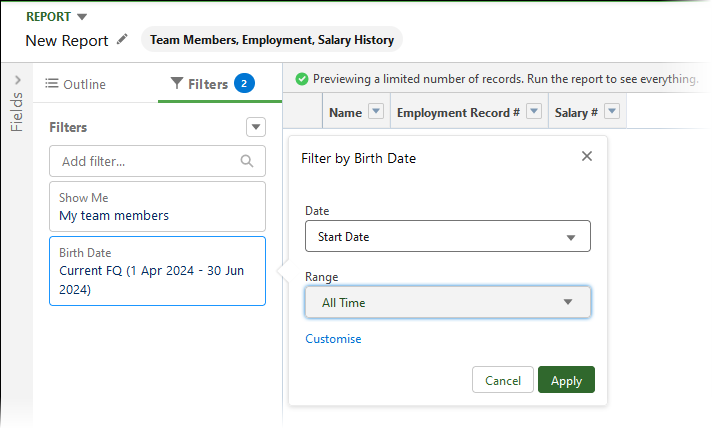
-
Select Apply.
-
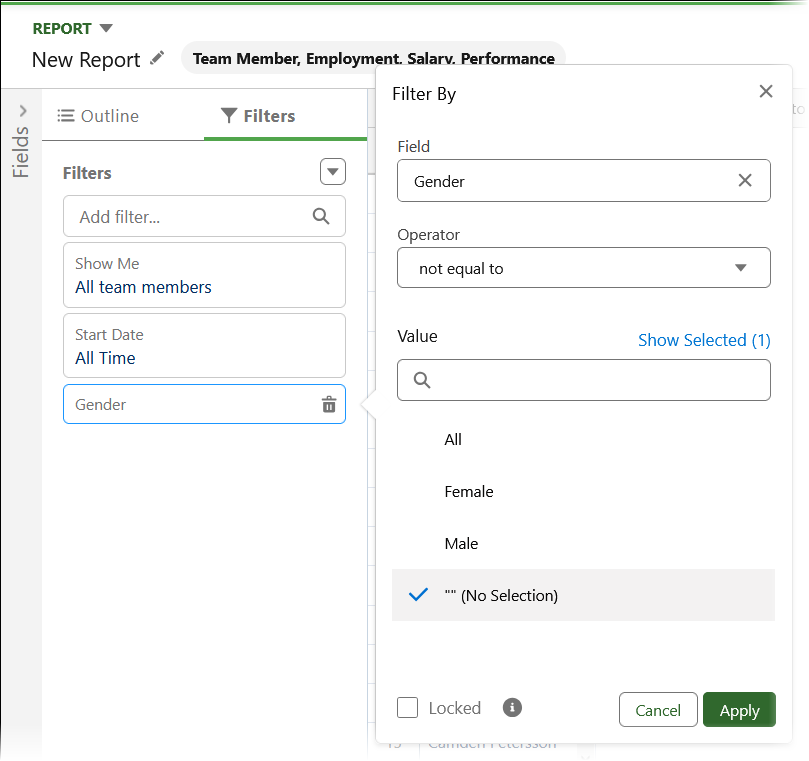
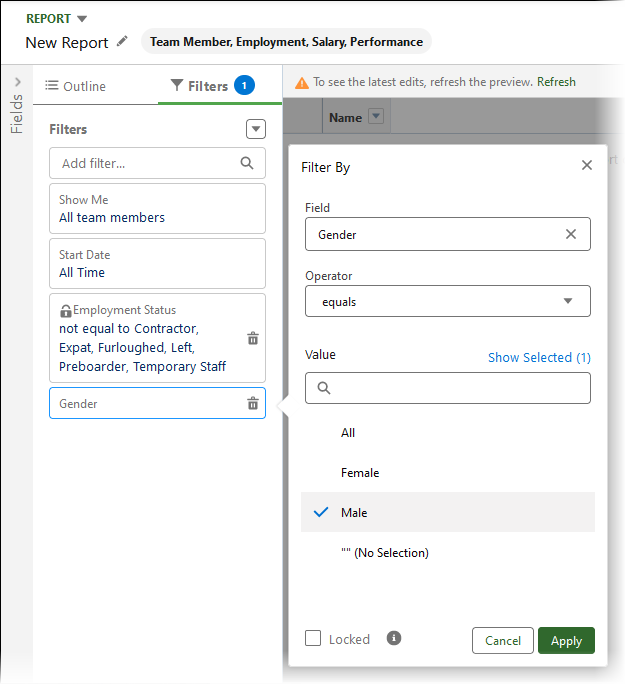
Select Add filter and enter gender, then select the Gender field.
-
Set the operator to not equal to and the value to "" - (No Selection):
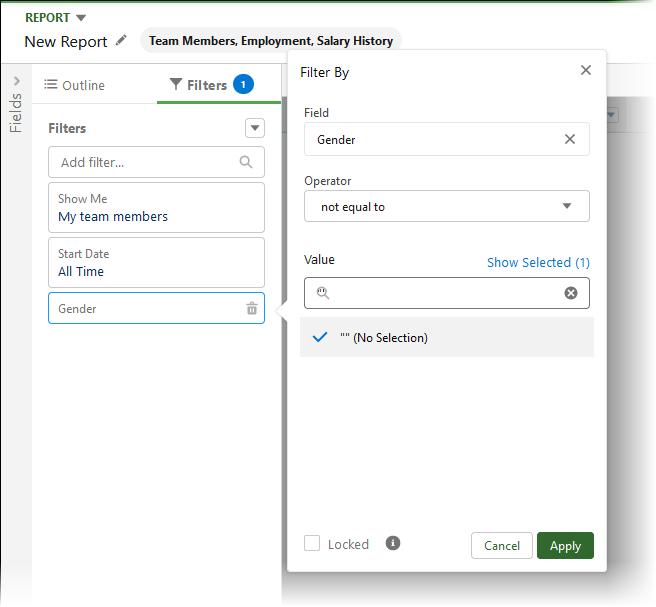
-
Select Apply.
-
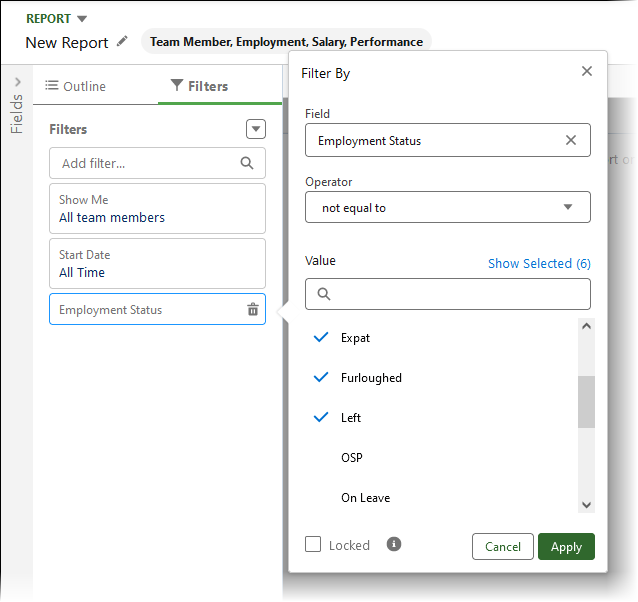
Select Add filter and enter employment, then select the Employment Status field.
-
Set the operator to not equal to and the value to the categories of employment status you want to exclude from the report. You can select multiple values.
-
Select Locked:
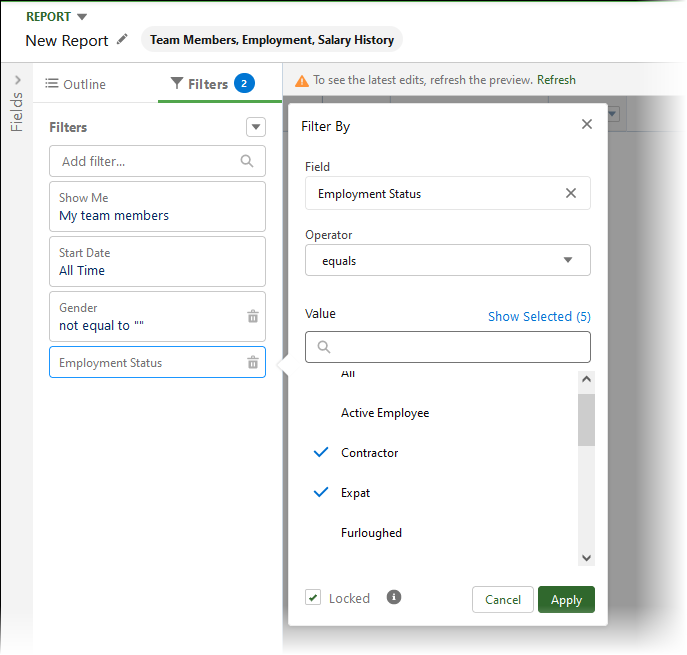
-
Select Apply.
-
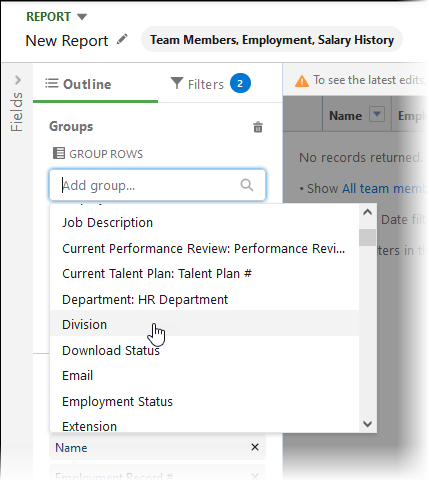
Select Outline to display the Outline panel.
-
In the Outline panel:
-
For GROUP ROWS select Country and Division:
-
For GROUP COLUMNS select Gender.
-
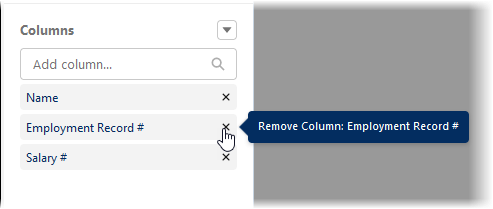
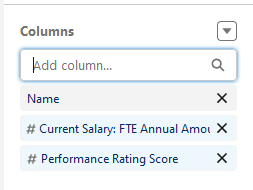
For Columns remove Employment Record # and Salary #:
-
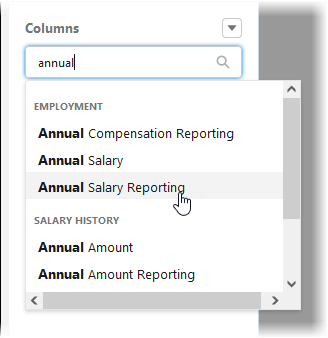
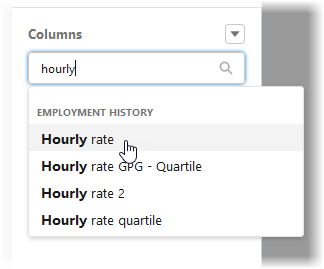
Add a column for the salary or hourly rate:
-
For the report based on annual salary, add a column for Annual Salary Reporting:
-
For the report based on hourly rate, add a column for Hourly Rate:
-
-
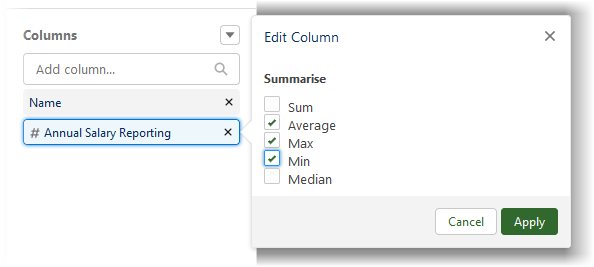
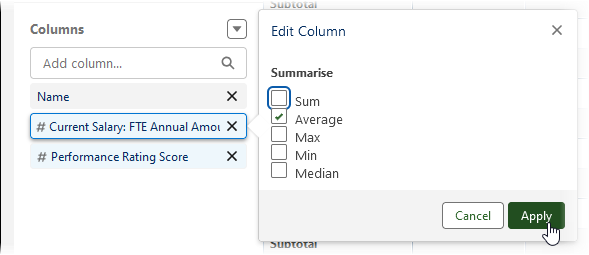
Edit the settings for the column:
-
For the report based on annual salary: Select the Annual Salary Reporting column and change the settings to deselect Sum and select:
Average
Max
Min
-
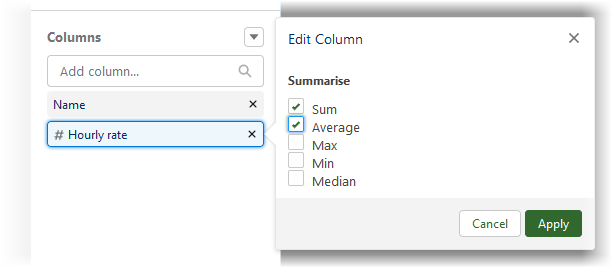
For the report based on hourly rate: Select the Hourly Rate column and change the settings to select:
Sum
Average
-
-
-
Select Apply.
-
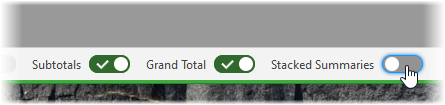
Deselect options:
-
For the report based on annual salary, at the bottom of the page deselect Stacked Summaries:
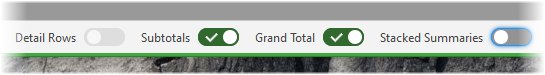
-
For the report based on hourly rate, at the bottom of the page deselect Detail Rows and Stacked Summaries:
-
-
Select Add Chart:
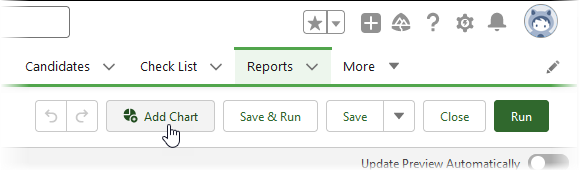
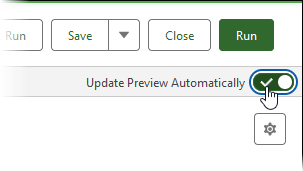
The display refreshes with a chart. If the chart is not automatically displayed, select Update Preview Automatically:
-
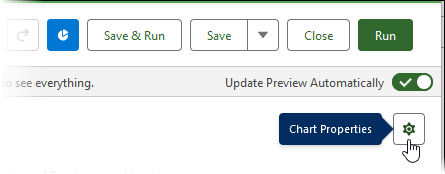
Select Chart Properties:
-
Define the axis:
-
For the report based on annual salary, in the chart properties panel for the Y-Axis select + Group and choose Gender from the picklist:
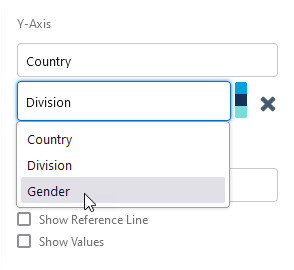
-
For the report based on hourly rate, in the chart properties panel for the Y-Axis select + Group and choose Gender from the picklist:
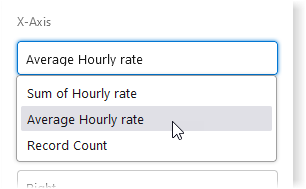
In the chart properties panel for the X-Axis select Average Hourly Rate:
-
-
Select Chart Properties to close the panel.
-
Select Save.
-
In the Save Report dialog complete the fields as follows:
Field What to enter For the report based on annual salary For the report based on hourly rate Report Name Gender pay by country/division: annual Gender pay by country/division: hourly Report Unique Name Automatically completed for you if left blank. Automatically completed for you if left blank. Report Description A meaningful description for the report to enable easy identification in a list of reports. For example:
Average annual salary reporting displayed by gender for each country and division
A meaningful description for the report to enable easy identification in a list of reports. For example:
Average hourly rate reporting displayed by gender for each country and division
Folder Select Select Folder and choose the folder you want to hold the report. Select Select Folder and choose the folder you want to hold the report. -
Select Save.
This report shows salary and bonus projection combined to give a total amount, classified by gender.
-
In Search Report Types enter Team Member, employment to filter the display of available report types.
-
From the display of report types select Team Member, Employment, Salary, Performance then select Start Report:
-
On the New Report page select the Filters pane.
-
Select Show Me and choose All team members:
-
Select Apply.
-
Select the date filter, choose EMPLOYMENT Start Date and set the Range to All Time:
-
Select Apply.
-
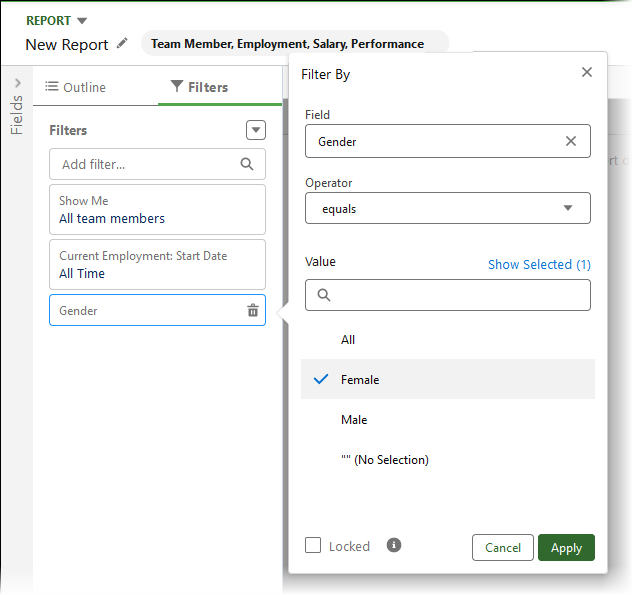
Select Add filter and enter gender, then select the Gender field.
-
Set the operator to not equal to and the value to "" - (No Selection):
-
Select Apply.
-
Select Add filter and enter employment, then select the Employment Status field.
-
Set the operator to not equal to and the value to the categories of employment status you want to exclude from the report. You can select multiple values.
-
Select Locked:
-
Select Outline to display the Outline panel.
-
In the Outline panel:
-
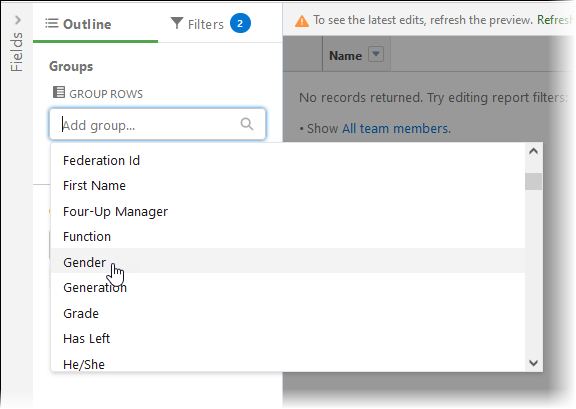
For GROUP ROWS select Gender:
-
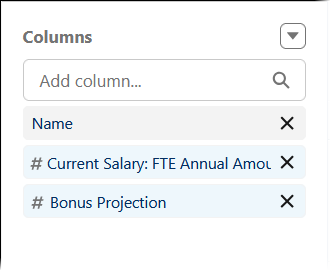
For Columns select Current Salary: FTE Annual Amount Reporting and Bonus Projection:
-
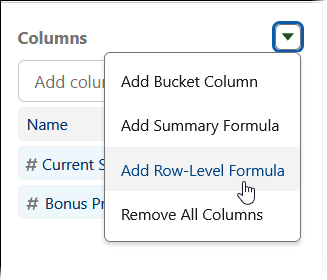
Select the Columns picklist and choose Add Row Level Formula:
-
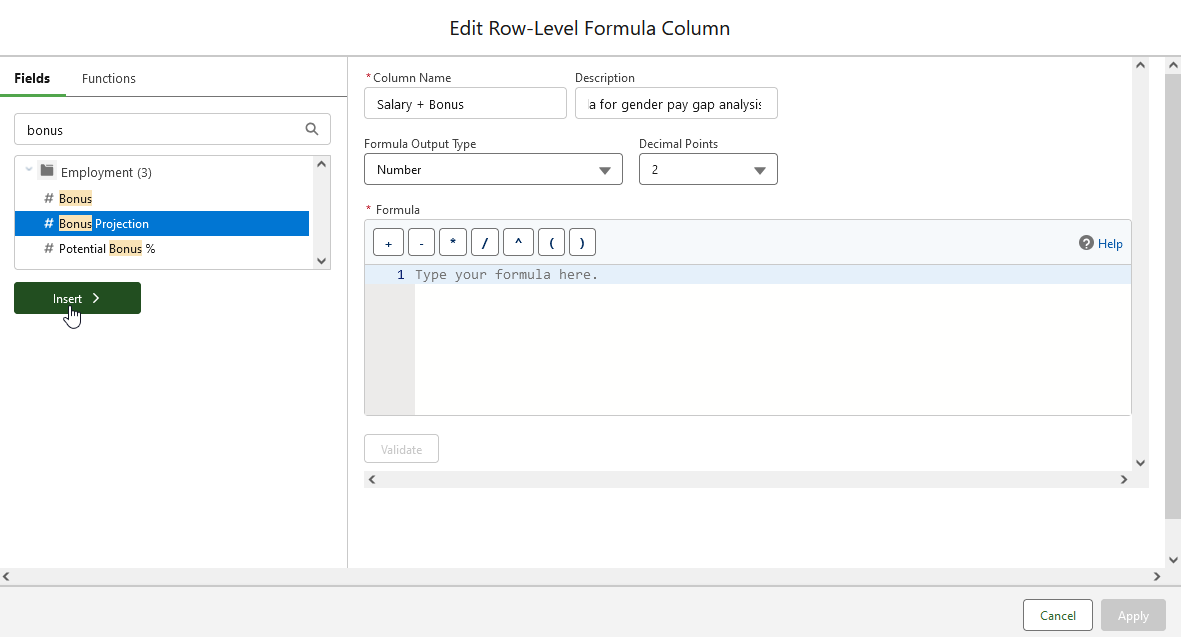
In the Edit Row-Level Formula Column dialog for Column Name enter Salary + Bonus and add a description.
-
In Fields enter bonus and choose Bonus Projection, then select Insert:
-
In Formula enter + at the end of the Bonus Projection field you just inserted, then select and insert the Current Salary: FTE Annual Amount Reporting field:
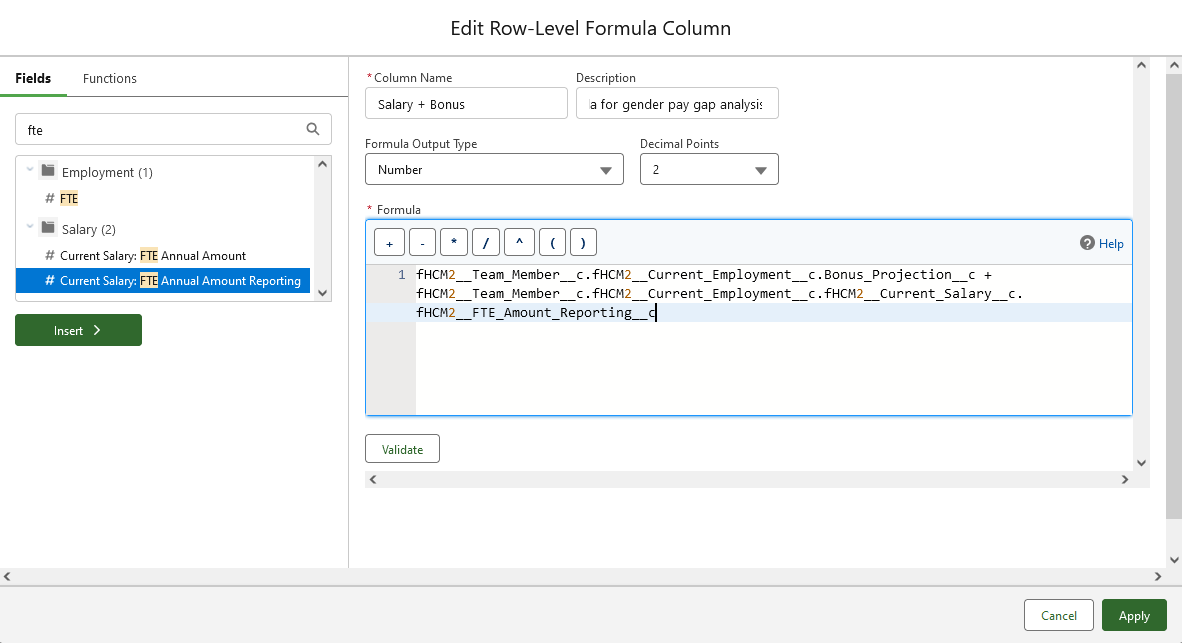
-
Select Apply.
-
In Columns select the Salary + Bonus formula , uncheck Sum and check Average:
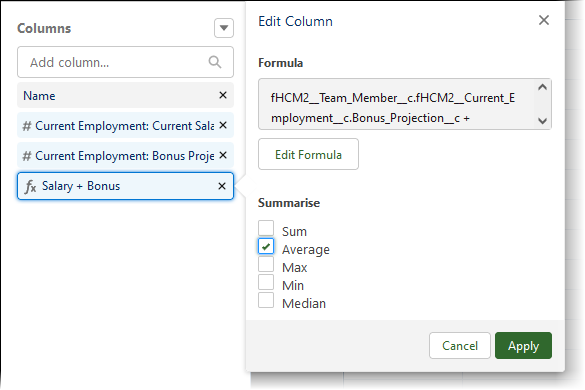
-
Select Apply.
-
-
Select Save.
-
In the Save Report dialog complete the fields as follows:
Field What to enter Report Name Total pay gender pay analysis Report Unique Name Automatically completed for you if left blank. Report Description A meaningful description for the report to enable easy identification in a list of reports. For example:
Total remuneration (salary and projected bonus) displayed by gender
Folder Select Select Folder and choose the folder you want to hold the report. -
Select Save.
These reports show:
-
Pay for male employees against their performance rating.
-
Pay for female employees against their performance rating.
-
In Search Report Types enter Team Member, employment to filter the display of available report types.
-
From the display of report types select Team Member, Employment, Salary, Performance then select Start Report:
-
On the New Report page select the Filters pane.
-
Select Show Me and choose All team members:
-
Select Apply.
-
Select the date filter, choose Start Date and set the Range to All Time:
- Select Apply.
-
Select Add filter and enter gender, then select the Gender field.
-
Define the value:
-
For the male pay report, set the operator to equals and the value to Male:
-
For the female pay report, set the operator to equals and the value to Female:
-
-
Select Apply.
-
Select Add filter and enter employment, then select the Employment Status field.
-
Set the operator to not equal to and the value to the categories of employment status you want to exclude from the report. You can select multiple values.
-
Select Locked:
-
Select Apply.
-
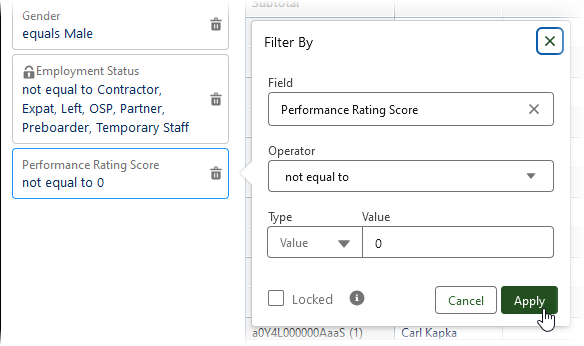
To exclude Team Members with a performance rating of 0, add a filter:
-
Select Add filter and enter score, then select Performance Rating Score.
-
Set the operator to not equal to and the value to 0.
-
Select Apply:
-
-
Select Outline to display the Outline panel.
-
In the Outline panel:
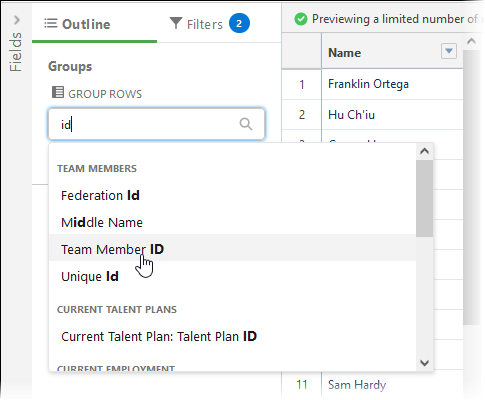
-
For GROUP ROWS select Team Member ID:
-
For Columns select Current Salary: FTE Annual Amount Reporting and Performance Rating Score:
-
For each of the columns just added, select them one at a time and change the settings to uncheck Sum and check Average, selecting Apply to close each set of settings:
-
-
Select Save.
-
In the Save Report dialog complete the fields as follows:
Field What to enter For the male pay report For the female pay report Report Name Male pay vs performance Female pay vs performance Report Unique Name Automatically completed for you if left blank. Report Description A meaningful description for the report to enable easy identification in a list of reports. For example:
Displays pay for male employees against their performance.
Displays pay for female employees against their performance. Folder Select Select Folder and choose the folder you want to hold the report. -
Select Save.
This report shows the percentage difference between male and female hourly rates of pay.
-
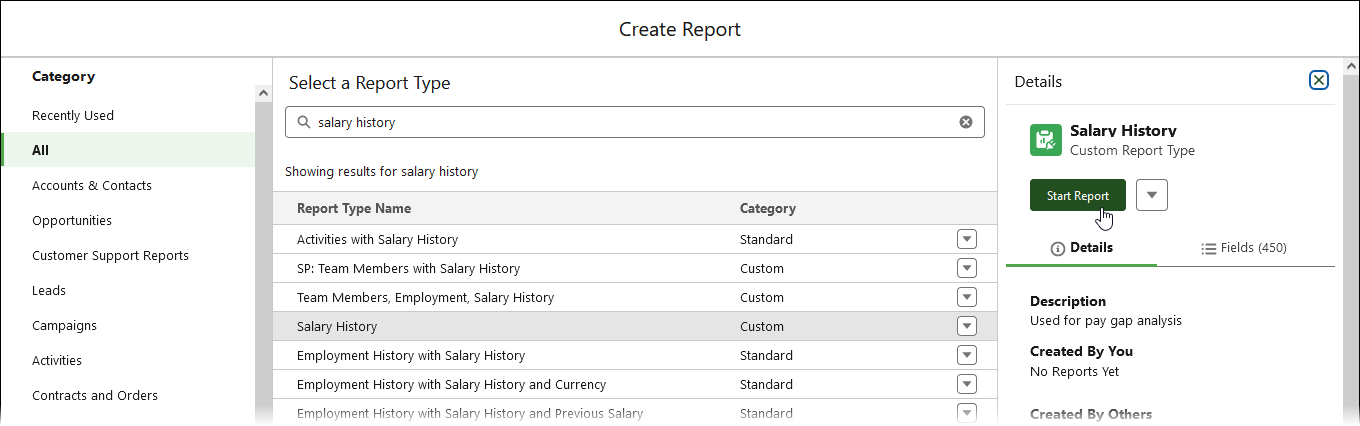
In Search Report Types enter Salary to filter the display of available report types.
-
From the display of report types select Salary History then select Start Report:
-
On the New Report page select the Filters pane.
-
Select Show Me and choose All salary history:
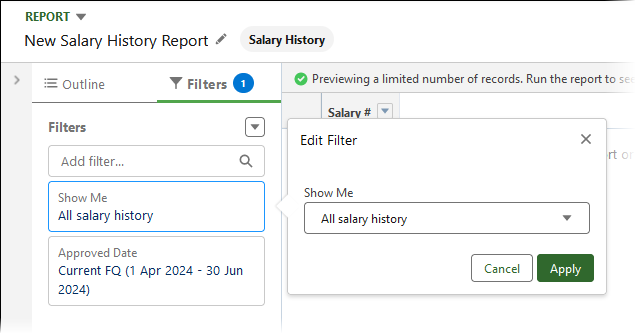
-
Select Apply.
-
Select the date filter, choose Employment: Start Date and set the Range to All Time:
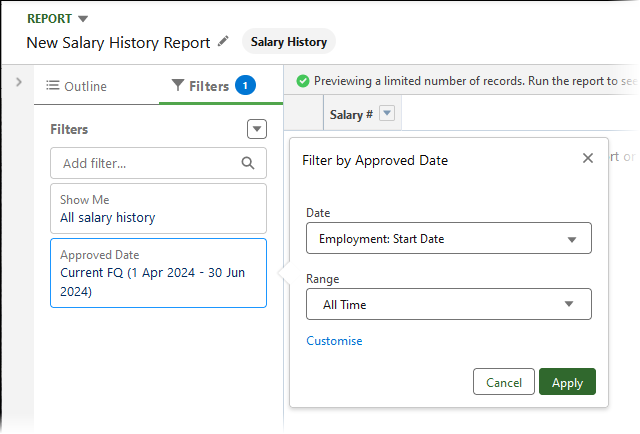
-
Select Apply.
-
Select Add filter and enter active, then select the Employment: Active field.
-
Set the value to True:
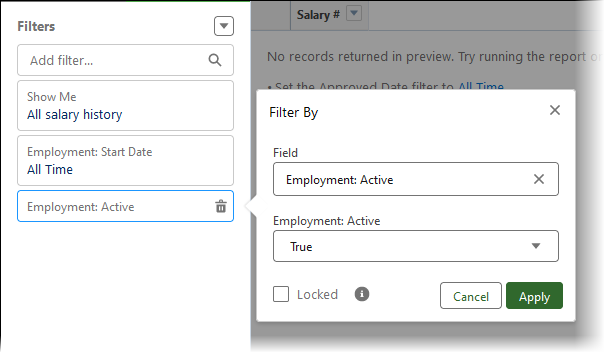
-
Select Apply.
-
Select Add filter and enter active, then select the Active field.
-
Set the value to True:
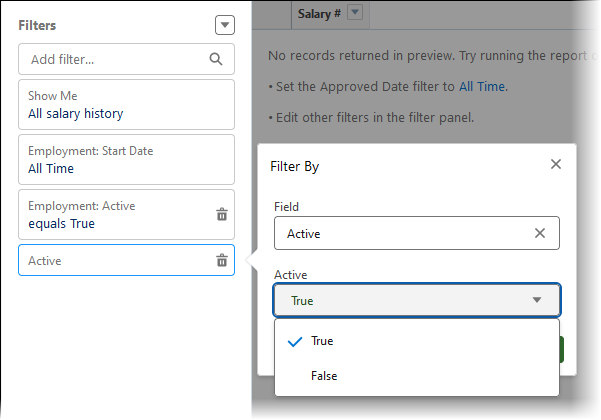
-
Select Apply.
-
Select Outline to display the Outline panel.
-
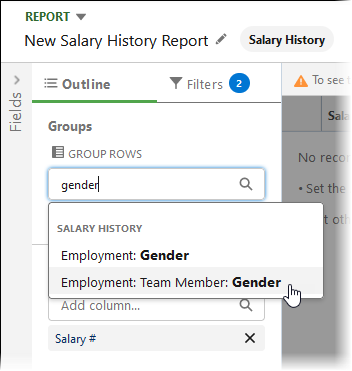
In the Outline panel:
-
For GROUP ROWS select Employment: Team Member: Gender:
-
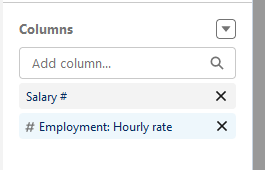
For Columns select Salary # and # Employment: Hourly Rate:
-
-
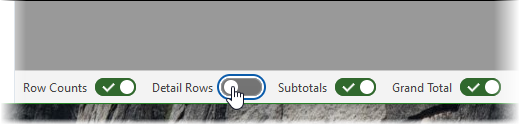
At the bottom of the page deselect Detail Rows:
-
Select Save to save the report.
-
In the Save Report dialog complete the fields as follows:
Field What to enter Report Name Percentage difference: male/female pay Report Unique Name Automatically completed for you if left blank. Report Description A meaningful description for the report to enable easy identification in a list of reports. For example:
Difference in value and percentage difference between hourly rates of pay for males and females
Folder Select Select Folder and choose the folder you want to hold the report. -
Select Save.
-
Select Run.
-
Now add two formulas to the report:
-
With the report displayed select Edit.
-
Select Outline to display the Outline panel.
-
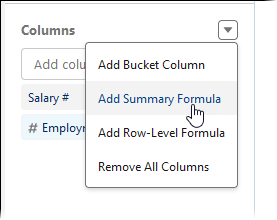
In the Outline panel Select the Columns picklist and choose Add Summary Formula:
-
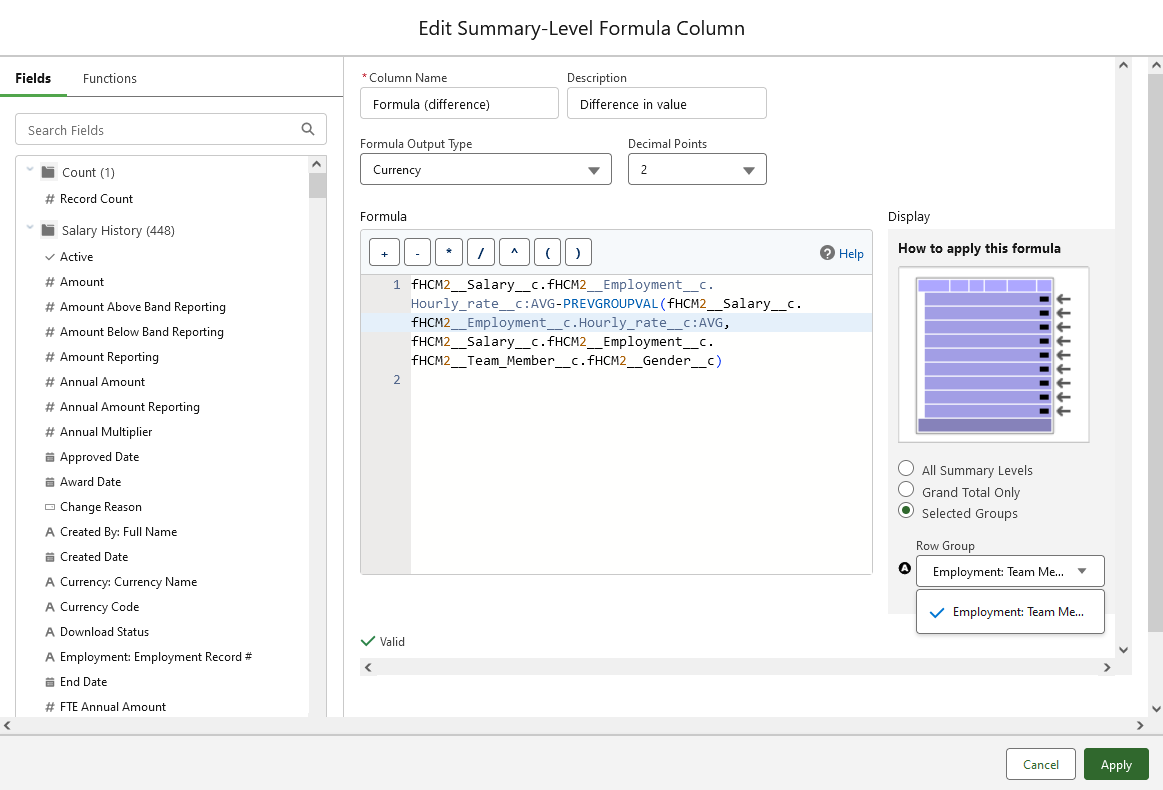
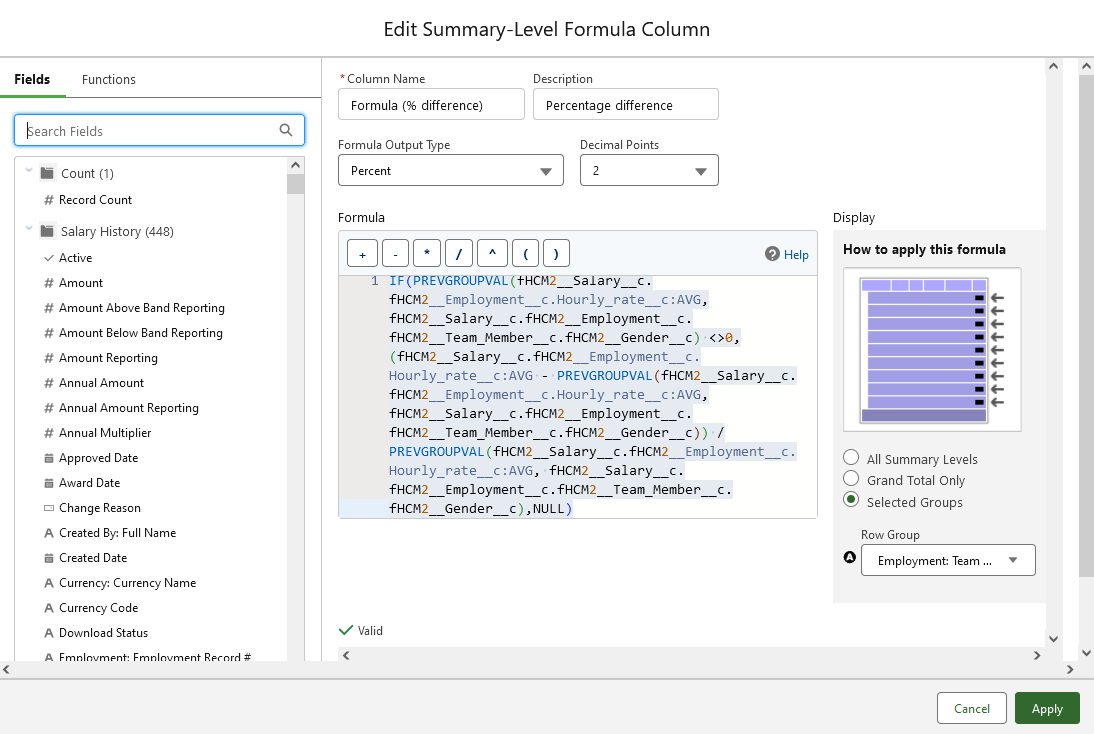
In the Edit Summary-Level Formula Column dialog complete the fields as follows:
Field What to enter Column Name Formula (difference) Description A meaningful summary, for example:
Difference in value
Formula Output Type Select the picklist and choose Currency Decimal Points 2 Formula fHCM2__Salary__c.fHCM2__Employment__c.Hourly_Rate__c:AVG - PREVGROUPVAL(fHCM2__Salary__c.fHCM2__Employment__c.Hourly_Rate__c:AVG, fHCM2__Salary__c.fHCM2__Employment__c.fHCM2__Team_Member__c.fHCM2__Gender__ c)
-
Select Validate to check the syntax of the formula.
-
Correct any indicated errors before selecting Validate again.
-
If you get repeated errors try replacing the fields in the copied formula by selecting them through Search Fields.
Display Selected Groups
On selection, the Row Group field is displayed
Row Group Select the picklist and choose:
Employment: Team Member: Gender
-
-
Select Apply.
-
In the Outline panel Select the Columns picklist and choose Add Summary Formula:
-
In the Edit Summary-Level Formula Column dialog complete the fields as follows:
Field What to enter Column Name Formula (% difference) Description A meaningful summary, for example:
Percentage difference
Formula Output Type Select the picklist and choose Percent Decimal Points 2 Formula IF(PREVGROUPVAL(fHCM2__Salary__c.fHCM2__Employment__c.Hourly_rate__c:AVG, fHCM2__Salary__c.fHCM2__Employment__c.fHCM2__Team_Member__c.fHCM2__Gender__c) <>0, (fHCM2__Salary__c.fHCM2__Employment__c.Hourly_rate__c:AVG - PREVGROUPVAL(fHCM2__Salary__c.fHCM2__Employment__c.Hourly_rate__c:AVG, fHCM2__Salary__c.fHCM2__Employment__c.fHCM2__Team_Member__c.fHCM2__Gender__c)) /PREVGROUPVAL(fHCM2__Salary__c.fHCM2__Employment__c.Hourly_rate__c:AVG, fHCM2__Salary__c.fHCM2__Employment__c.fHCM2__Team_Member__c.fHCM2__Gender__c),NULL)
-
Select Validate to check the syntax of the formula.
-
Correct any indicated errors before selecting Validate again.
-
If you get repeated errors try replacing the fields in the copied formula by selecting them through Search Fields.
Display Selected Groups
On selection, the Row Group field is displayed
Row Group Select the picklist and choose:
Employment: Team Member: Gender
-
-
Select Apply.
-
-
Select Save.
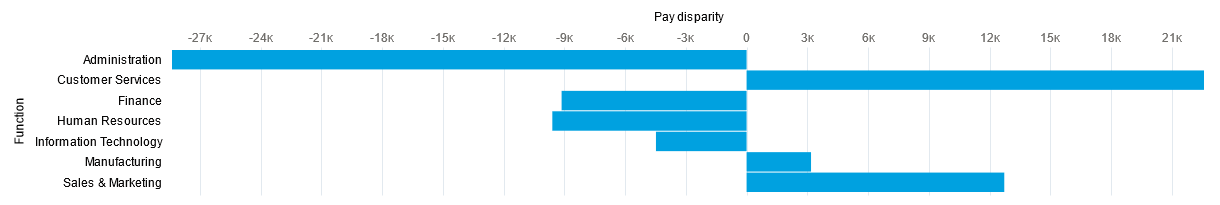
This report displays the difference in average annual reported salary between male and female employees analyzed by employment function. Example functions are administration, customer services, finance, manufacturing and so on. The report includes:
-
Actual currency values for each employee.
-
Subtotals by function.
-
The difference between the average salaries for male and female employees expressed as a positive or negative value. Positive values indicate average male salaries exceed female, negative values indicate average female salaries exceed male.
-
The option to add a chart.
-
In Search Report Types enter Team Member, employment to filter the display of available report types.
-
From the display of report types select Team Member, Employment, Salary, Performance then select Start Report:
-
On the New Report page select the Filters pane.
-
Select Show Me and choose All team members:
-
Select Apply.
-
Select the date filter, choose Start Date and set the Range to All Time:
-
Select Apply.
-
Select Add filter and enter employment, then select the Employment Status field.
-
Set the operator to not equal to and the value to the categories of employment status you want to exclude from the report. You can select multiple values.
-
Select Locked:
-
Select Apply.
-
Select Add filter and enter gender, then select the Gender field.
-
Set the operator to equals and the value to Male:
-
Select Apply.
-
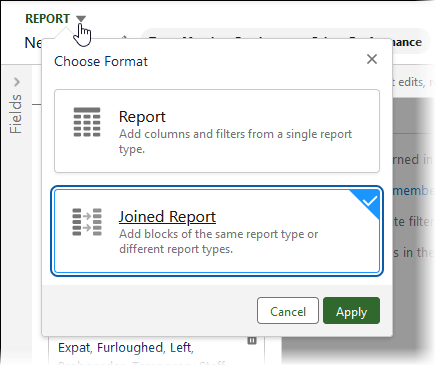
To enable the report to display data for female pay it must be set as a joined report.
At the top of the page select the Report picklist and choose Joined Report:
-
Select Apply.
-
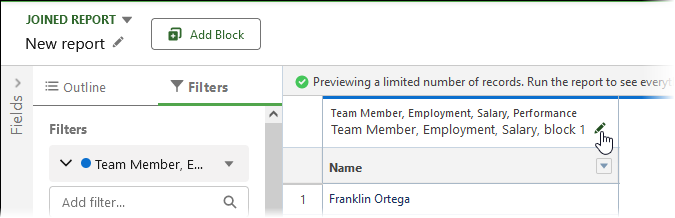
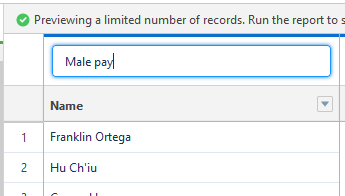
Select the pencil edit icon to change the name of the block to Male pay:
-
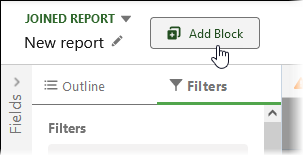
Select Add Block:
-
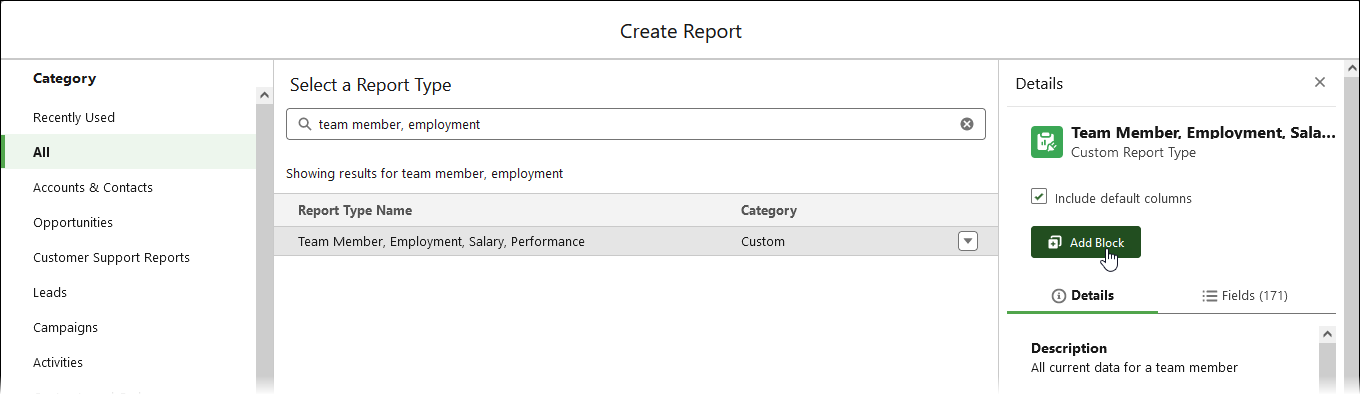
In the Create Report dialog select the Team Member, Employment, Salary, Performance report type, then select Add Block:
-
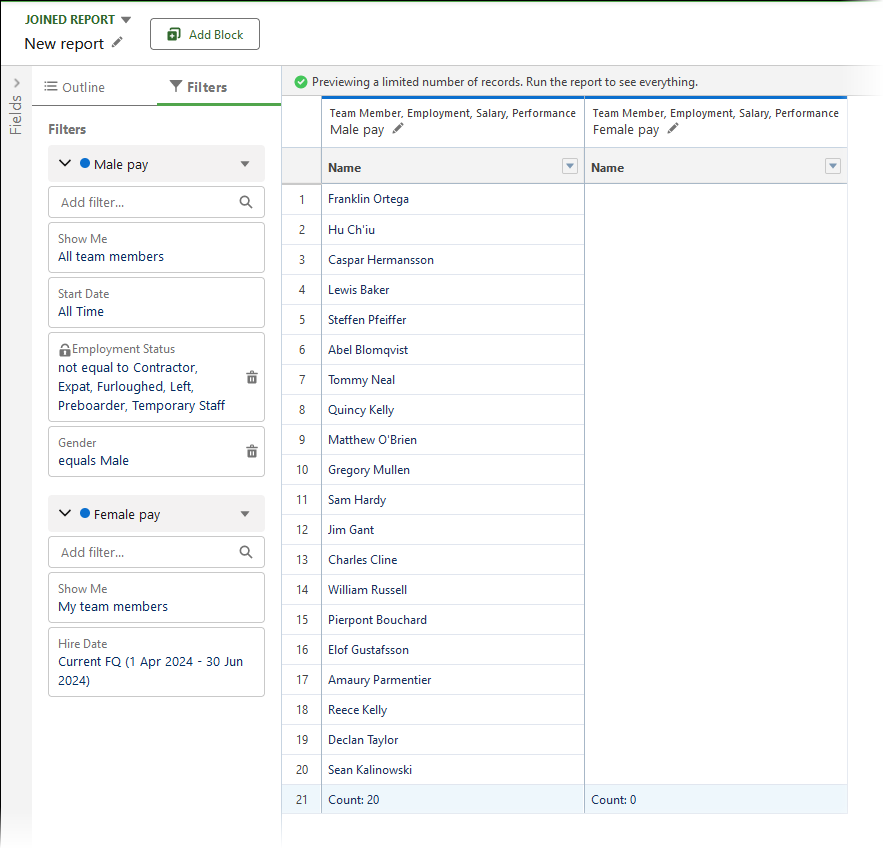
Refresh the report preview to display the second block, then select the pencil edit icon to change the name of the block to Female pay.
The page now displays the 2 blocks for the joined report. The male pay block is populated and the female pay block is empty. Each block has its own set of filters:
-
For the Female pay block:
-
Select the Show Me filter and choose All team members.
-
Select Apply.
-
Select the date filter, choose Start Date and set the Range to All Time.
-
Select Apply.
-
Select Add filter and enter employment, then select the Employment Status field.
-
Set the operator to not equal to and the value to the categories of employment status you want to exclude from the report. You can select multiple values.
-
Select Locked:
-
Select Add filter and enter gender, then select the Gender field.
-
Set the operator to equals and the value to Female:
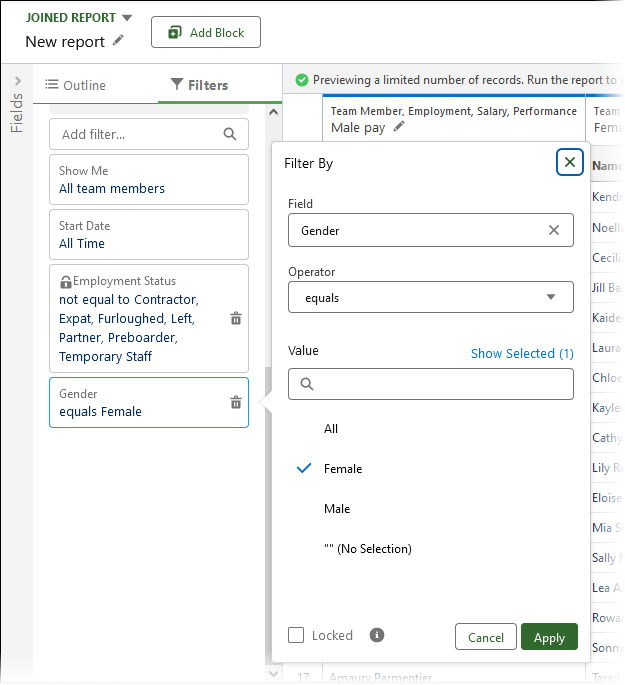
-
Select Apply.
-
-
Select Outline to display the Outline panel.
-
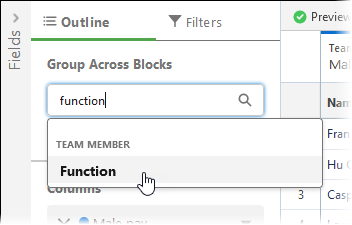
In the Outline panel:
-
For Group Across Blocks select Function:
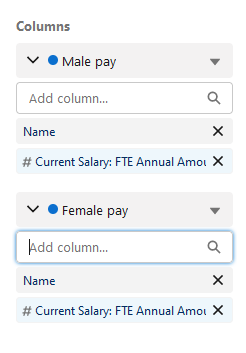
-
For Columns select Current Salary: FTE Annual Amount Reporting for the Male pay and Female pay blocks:
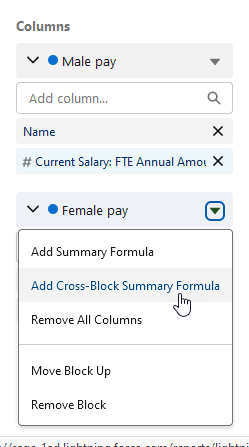
-
Select the picklist for either the Male pay or Female pay blocks - both offer the same options - and select Add Cross-Block Summary Formula:
-
In the Edit Summary Level Formula Column dialog, complete the fields as follows:
Field What to enter Column Name Pay disparity Description A meaningful summary of the column content, for example:
Displays the currency value of the pay disparity between male and female employees.
Formula Output Type Currency Decimal Points 2 Formula Build the formula:
-
In the Fields search box for the Male pay section enter FTE and select Current Salary: FTE Annual Amount Reporting.
-
Select the operator picklist at the bottom of the field selection panel and choose Average to replace Sum:
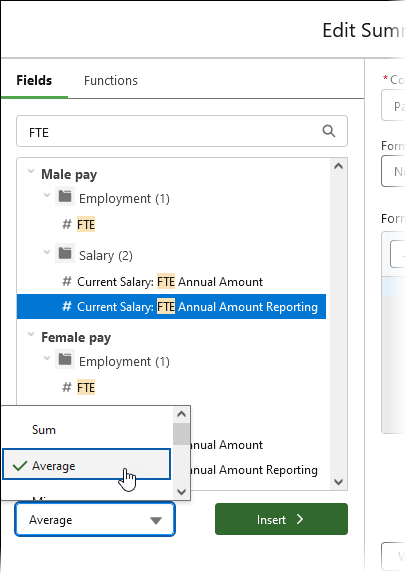
-
Select Insert.
-
After the field string in the Formula field enter a minus sign (-)
-
In the Fields search box for the Female pay section enter FTE and select Current Salary: FTE Annual Amount Reporting.
-
Select the operator picklist at the bottom of the field selection panel and choose Average to replace Sum.
-
Insert the field after the minus sign:
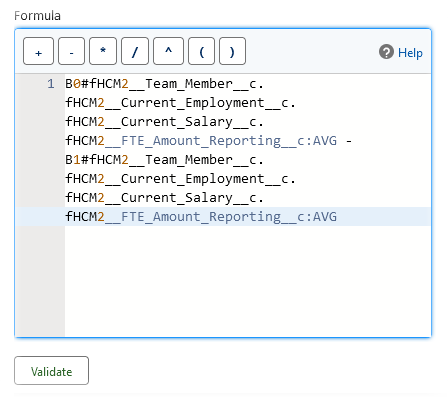
-
Select Validate to check the formula syntax.
-
Select Apply to add the formula column.
The formula calculates the difference in average pay between male and female employees for each function within the organization. Positive values indicate average male salaries exceed female, negative values indicate average female salaries exceed male.
-
-
-
To enhance report presentation and visual impact you can add a chart:
-
Select Add Chart:
-
Select Chart Properties:
-
Select the properties you want for the chart, for example:
-
Bar
-
Y-Axis: Function
-
X-Axis: Pay Disparity
-
-
-
Select Save to save the report.
-
In the Save Report dialog complete the fields as follows:
Field What to enter Report Name Gender pay disparity Report Unique Name Automatically completed for you if left blank. Report Description A meaningful description for the report to enable easy identification in a list of reports. For example:
Difference in value between annual pay for males and females
Folder Select Select Folder and choose the folder you want to hold the report. -
Select Save.
Create a dashboard
A dashboard enables you to display the report data in chart form and make it available through the HR portal.
-
Select the App Launcher, search for and select Dashboards.
-
On the Reports page select New Dashboard.
-
On the New Dashboard dialog, complete the fields as follows:
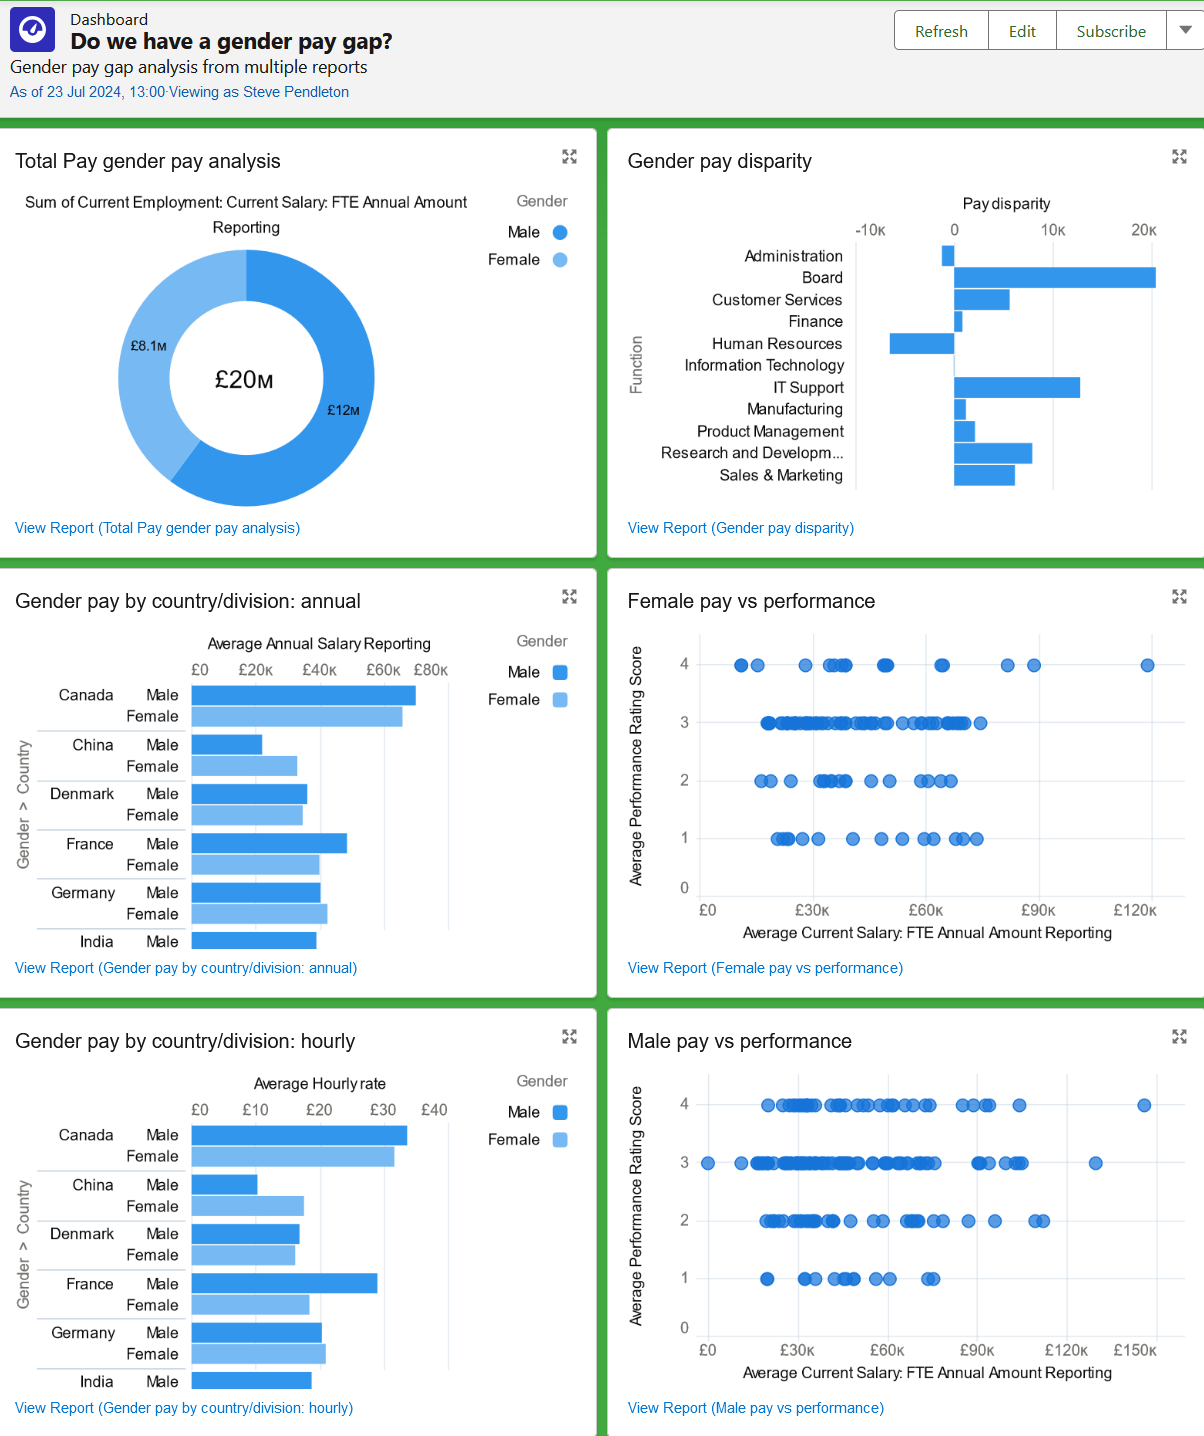
Field What to enter Name A business question the dashboard seeks to answer. The name is displayed as the title of the dashboard in the HR Manager portal. For example:
Do we have a gender pay gap?
Description A meaningful description for the dashboard to eanable easy identification. The description is displayed as a subheading on the dashboard. For example:
Gender pay gap analysis from multiple reports.
Folder Select Select Folder and choose the folder you want to hold the dashboard.
-
Select Create.
Sage People displays the dashboard framework for you to start adding reports:
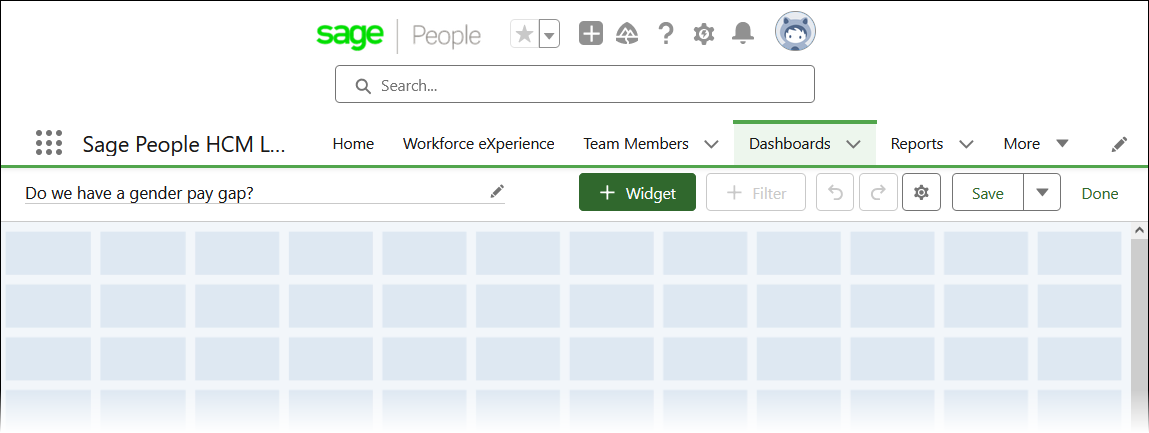
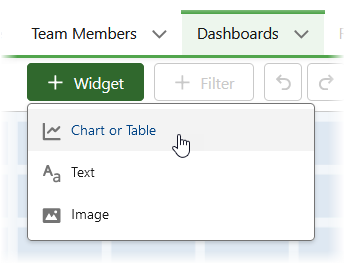
-
Select + Widget and choose the type of component you want to add, typically Chart or Table:
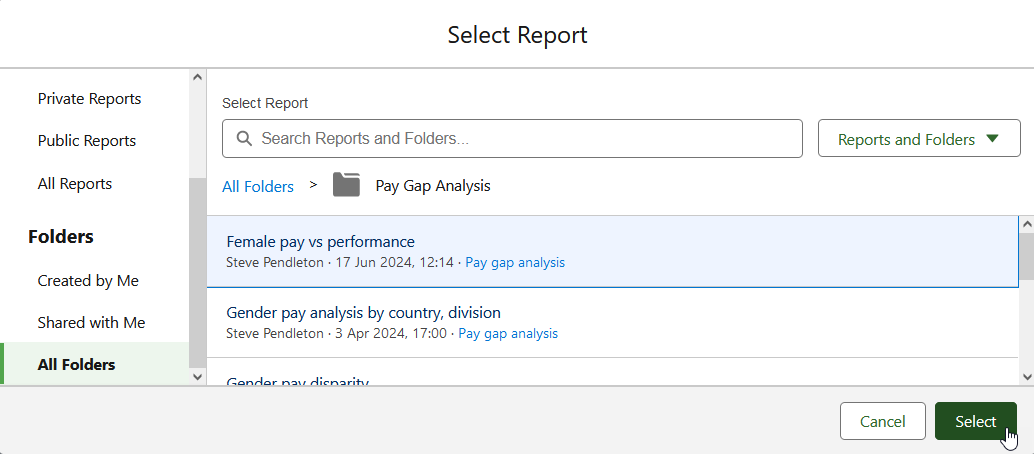
Sage People displays the Select Report dialog.
-
Navigate to the first report you want to display on the dashboard and select Select:
Sage People displays the Add Widget dialog for you to choose how you want the dashboard to display the data in the report:
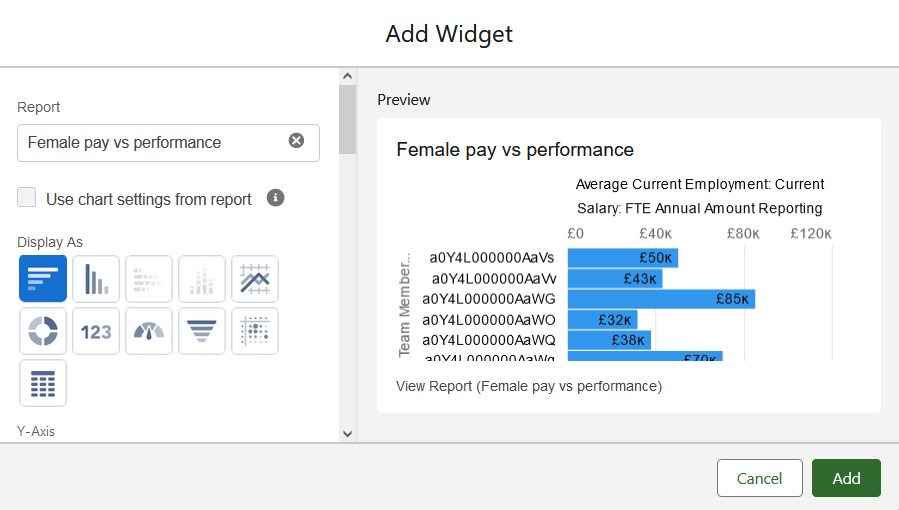
-
Choose the options you want for the display and select Add:
-
Repeat the process to add the report data you want to display on the dashboard.
Which chart types are best for the pay gap analysis reports?
The dashboard Add Widget dialog enables you to choose the chart type, title, axis settings, chart theme and other details for each chart. If your report includes a chart you can use that, or define a different chart type for dashboard display.
Suggested chart settings for each of the pay gap analysis reports:
-
Gender pay gap analysis
Horizontal bar. Use the chart settings from the report.
-
Total pay
Donut
-
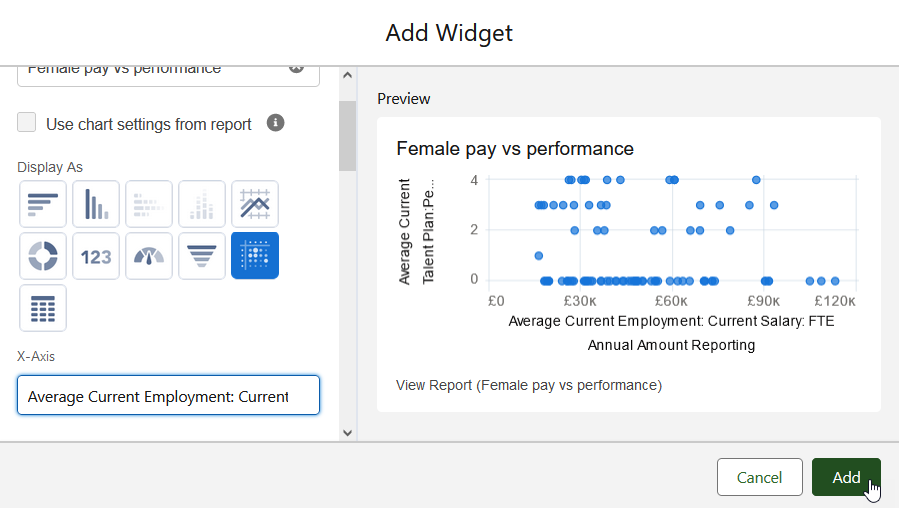
Pay against performance
Scatter chart
X-Axis: Average Current Salary: FTE Annual Amount Reporting
Y-Axis: Average Performance Rating Score
-
Percentage difference in pay
Because of the single value calculated by the report , a chart adds little value.
-
Gender pay disparity
Horizontal bar. Use the chart settings from the report.