You can use the Sage People reports and dashboards to provide granular reporting on many aspects of your organization. This can include team member information, headcount, absence, performance, objectives, and employee turnover.
Reports
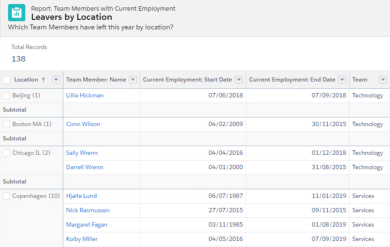
Reports are available in a range of formats, typically in table form. You can group, sort, and filter report tables and they can include a graphical chart.
Reports support multiple data objects, and you can export them to Excel, as data only, or as a formatted spreadsheet.
Dashboards
A dashboard is a collection of graphical reports. We designed these to give an executive summary of a specific area, such as absence, performance, or headcounts.
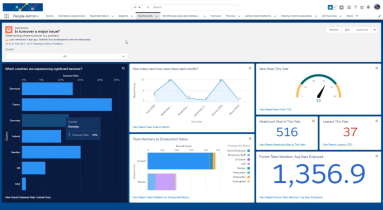
Dashboards support up to 20 separate report components. Users viewing dashboards must have access to the report folders that contain the dashboard component source data.