To run a report that has already been set up:
-
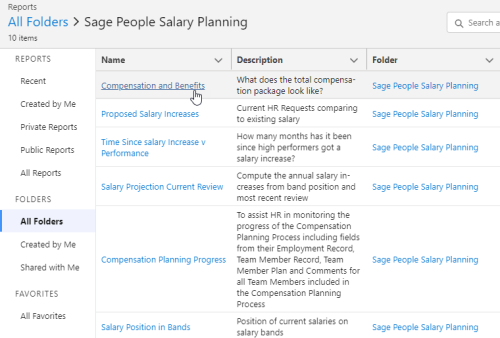
Select the Reports or Dashboard tab.
-
Select a view that displays a subset of reports or folders:
-
Created by Me
-
Private Reports/Dashboards
-
Public Reports/Dashboards
-
All Reports
Or use the folder view to display report folders:
-
All Folders
-
Created by Me
-
Shared with Me
Select All Favorites to display reports/dashboards and folders that you have marked as favorite.

-
-
When you have located the report or dashboard you want to run, select the report name.
Dashboards that have not been scheduled must be manually refreshed to see the latest data. Select Refresh to pull the latest data into the dashboard. To schedule a refresh, select Subscribe, then select a refresh schedule for your dashboard. Reports automatically use the latest data when they are opened.
Using a report
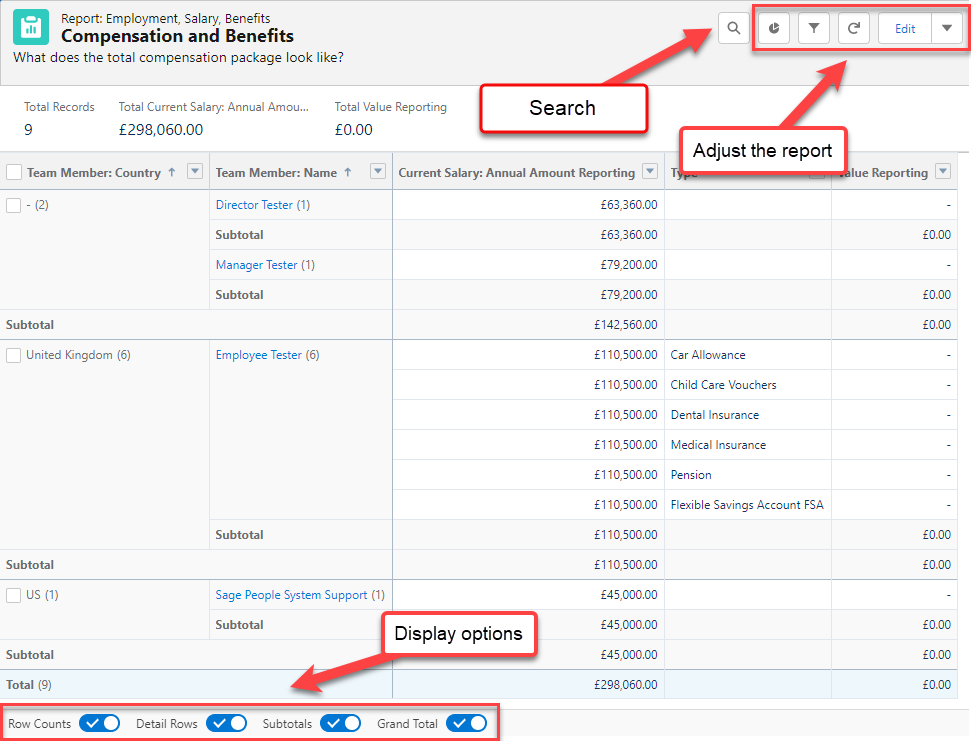
You can modify the information displayed in a report using the buttons on the page:
-
Toggle Chart: toggle a chart on and off
-
Chart Properties: adjust the way the chart is displayed, including changing the chart's axis, stacking, or "sliced by" values
-
Filters: adjusts settings for the report's filters. Any filters in the report can be changed to include or exclude matching information.
-
Search: perform a text search on the displayed report to highlight the text string you have entered.
-
Display options: Change the table display options at the bottom of the page.
Using a dashboard

You can:
-
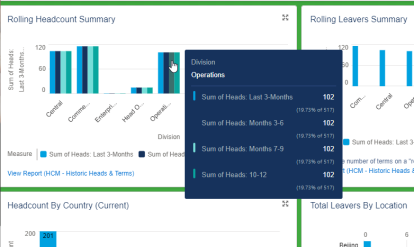
Hover over a chart element to display further details.
-
Select a dashboard element to open the source report that the dashboard chart is based on.
-
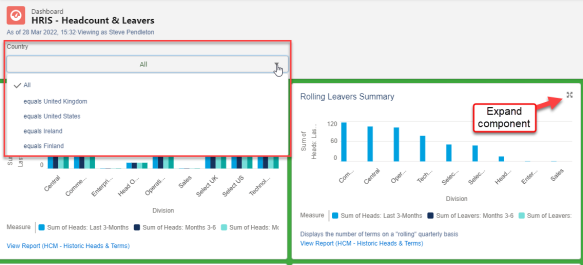
Select the Expand button in the top right of a dashboard component to display it in full screen. The full screen view also allows you to download or share the component.
If a dashboard has filters built in, these appear at the top of the dashboard. Select the filter to apply it to all charts on the dashboard.

