Talent Plan | Business Context
Overview
The Talent Plan process enables organizations to identify team members with high potential as well as team members who are at risk of leaving. Talent planning can be an integral part of an organization’s performance and talent management strategy, providing input into development planning associated with competency or skills assessments, or as a stand-alone quick view of identifying high performing or flight risk team members.
How customers use Talent Plan
Talent Plan enables the organization to create an assessment of a team members to determine their current performance level and potential, as well as the risk of their leaving, the likely reason, and consequence of leaving for the organization.
Sage People represents the results of the assessment in WX on a Talent Plan Org Chart for the team and if configured, on an overall 9 box grid. If a team member is identified to be at risk of leaving, managers can enter the steps they plan on taking to retain the employee.
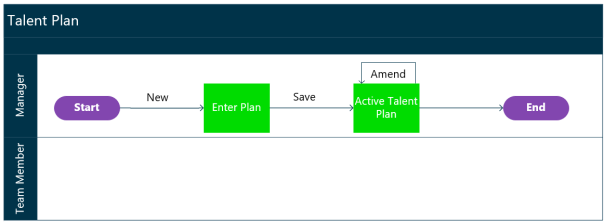
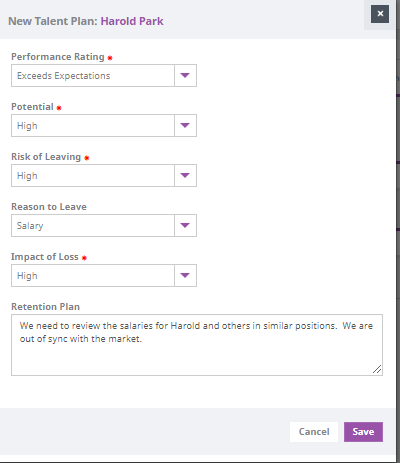
Team members cannot access the Talent Plan process. Either the team member’s manager or the HR team usually enter the talent plan, as shown in the following diagram:
WX location
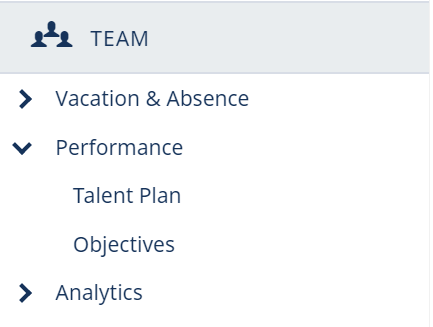
The Talent Plan process is usually located within the Performance service for managers only to see:
Talent Plan detail view
There are two Talent Plan detail views in Sage People:
-
Org Chart view
-
9 Box Grid view
Org Chart view
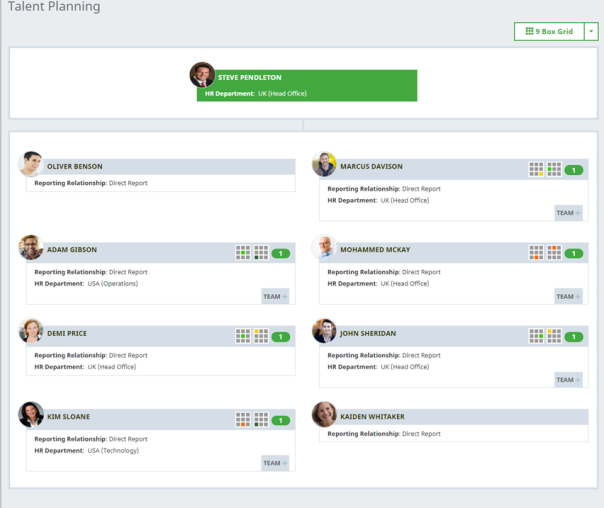
The Org Chart view is the default view for the Talent Plan process:
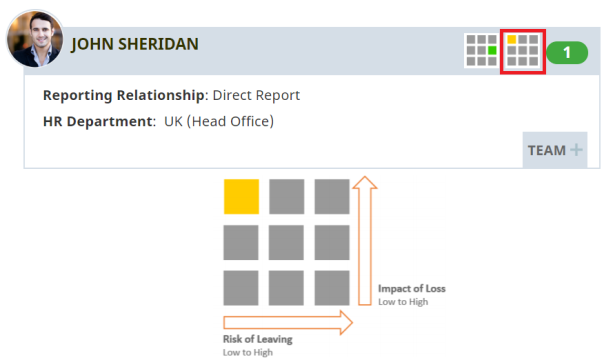
In the org chart view, each team member has two 9-box grids next to their name which use colored tiles to represent:
-
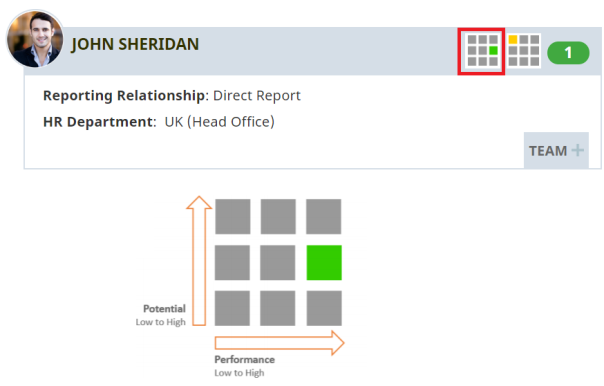
Performance against potential on the left:
In this example, John Sheridan is performing at a high level and has a medium level of potential for advancement.
-
Risk of leaving against impact of loss on the right:
In this example, John Sheridan has a low risk of leaving and his impact of loss to the organization would be high at this time.
Sage People calculates performance against potential and risk of leaving against impact of loss based on the data that is entered in the team member’s talent plan:
For more information on how Sage People normalizes ratings for performance against potential, see Score normalization process (help center).
9 Box Grid view
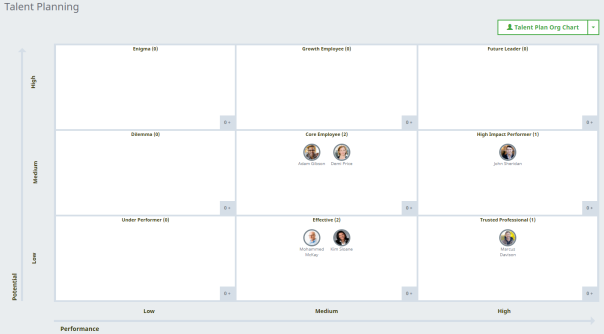
WX enables managers to display talent plans as 9 box grids for their complete team. Team members are placed on the grid according to their Performance and Potential ratings:
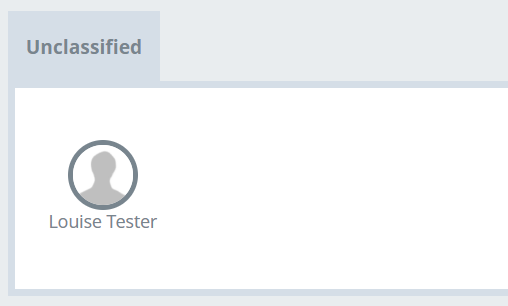
Team members without a talent plan are displayed as Unclassified beneath the team 9 box grid:
Talent Plan reports
The following standard reports can be found on the Reports tab:
Features
-
Talent Planning can either be done as an HR driven process, meaning any updates to a talent plan are made by HR people via the HR Portal, or as a WX process, meaning any updates to a talent plan are made by managers in WX.
Assumptions
-
The 9 values that appear within the 9 box grid can be updated based on customer requirements.
-
If there are more than three ratings used for Potential, Performance, Risk of Leaving, or Impact of Loss, the standard score normalization process (help center) will be followed.
Customer input
As part of the planning process, customers will be asked to answer the following questions:
- Will you use talent planning?
- Who will enter talent plans?
HR only
Manager and HR
-
Do you want to use the 9 Box Grid to visually display performance against potential for all members of a manager’s team?
-
If you are using the 9 Box Grid, what labels to you want to use to assign to each box of the grid? Standard labels are described in the following table:
Standard values for performance and potential
Standard description Low Performance, Low Potential
Under Performer
Low Performance, Medium Potential
Dilemma
Low Performance, High Potential
Enigma
Medium Performance, Low Potential
Effective
Medium Performance, Medium Potential
Core Employee
Medium Performance, High Potential
Growth Employee
High Performance, Low Potential
Trusted Professional
High Performance, Medium Potential
High Impact Performer
High Performance, High Potential
Future Leader
-
What reasons for potential flight risk will you track? Standard reasons include:
-
No career progression
-
Seeking new skills
-
Salary
-
Personal/family change
-
Work environment
-
Fitting in to team
-
Other
-
-
The standard 3 level Low, Medium and High scale is recommended for assessing Potential, Performance, Risk of Leaving and Impact of Loss. Another scale can be used, but score normalization follows the standard algorithm.
