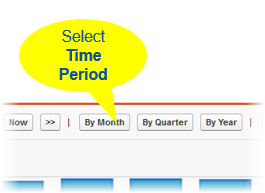
The Turnover report displays a window of data drawn from 12 consecutive time periods, and defaults to monthly data running back from the most recent complete period. Select the buttons to change the frequency of the analysis:
- By Quarter
Displays data for every third month, running back for 12 quarters from the most recently completed 3-month period.
For example, running the report in mid-February 2016 displays data for January 2016, October 2015, and so on, back to April 2013.
- By Year
Displays data for every twelfth month, running back for 12 years from the most recently completed 12-month period.
For example, running the report in mid-February 2016 displays data for January 2014, January 2013, and so on, back to January 2005.
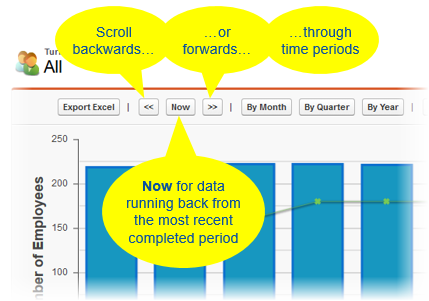
Use the scroll buttons to move the display window backwards or forwards one time period at a time. The window remains 12 time periods wide:
Select Now to redisplay the report running back from the most recently completed time period: