Overall WX Report visibility is controlled by Policy - Reporting is either on or off. When switched on, all managers assigned to the Policy can see all reports. For reports defined as visible to Team Members, all Team Members with relevant data can see the reports. Ensure that report data content is appropriate for the audience.
WX Reports uses the position of the logged-in user in the organizational hierarchy to control data visibility within each report. Refine the data displayed by using the Show picklist for the underlying Report:
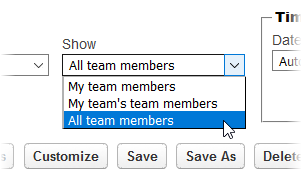
- My [object name]
Shows the records directly associated with the logged in user's Team Member.
- My team's [object name]
Shows the records directly associated with the logged in user's direct reports.
- All [object name]
Shows the records directly associated with the logged in user's direct reports and lower levels in the organization.
To get best results, follow these guidelines:
-
Design the report as the answer to a specific question, such as:
- How many people work for me?
- Who is on holiday or off sick today?
- How many objectives do each of my team have?
- Who needs to add emergency contacts?
- Keep report content simple.
- When naming reports, consider including the name of the base object to make reports easier to identify. To help identify your custom reports, you can include Custom in the name.
- Charts require at least one numerical field to define axis values and enable display - reports that include only text fields display in table format but cannot display charts. You can often add a COUNT field to supply the necessary values.
- Ensure numerical data is easily displayed on bar, line, doughnut, or pie charts. Design for visual display to maximize impact.
- Bear in mind the most common display size used by your target audience, and optimize report content for that size.
- Avoid including too many columns of data, reducing the need for horizontal scrolling of Table displays and ensuring that data can be easily read and understood. Columns containing long text strings take up more horizontal space and reduce the number of columns you can display without scrolling. Wherever possible, size the report to fit the most common display size used by your target audience without horizontal scrolling. Producing charts from multiple columns of data tends to produce confusing results that are difficult to interpret.
Terminated employees are not included in WX reports for managers with no active employees.