Line Chart
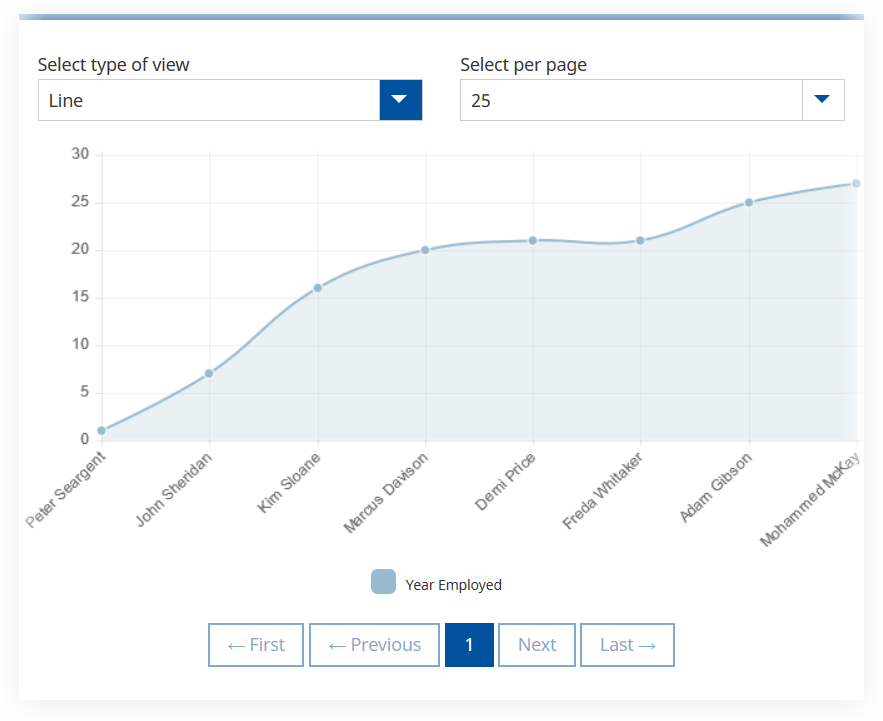
- The legend includes labels for all charted lines.
- Select a label to toggle that line on or off in the chart.
Bar Chart
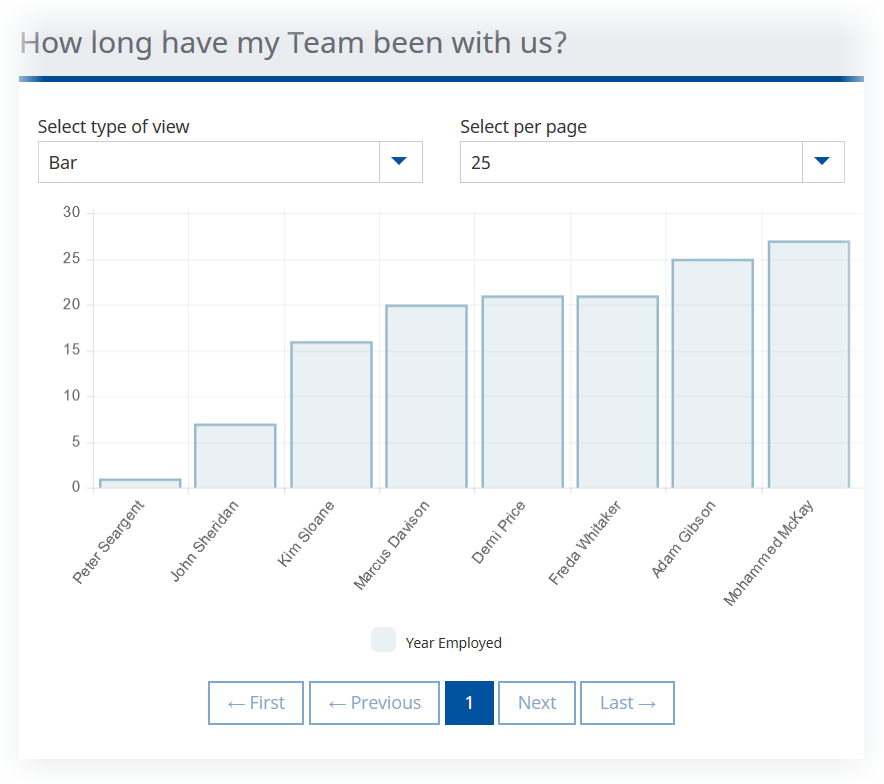
- The legend includes labels for all charted bar types.
- Select a label to toggle that bar on or off in the chart.
Horizontal Bar Chart
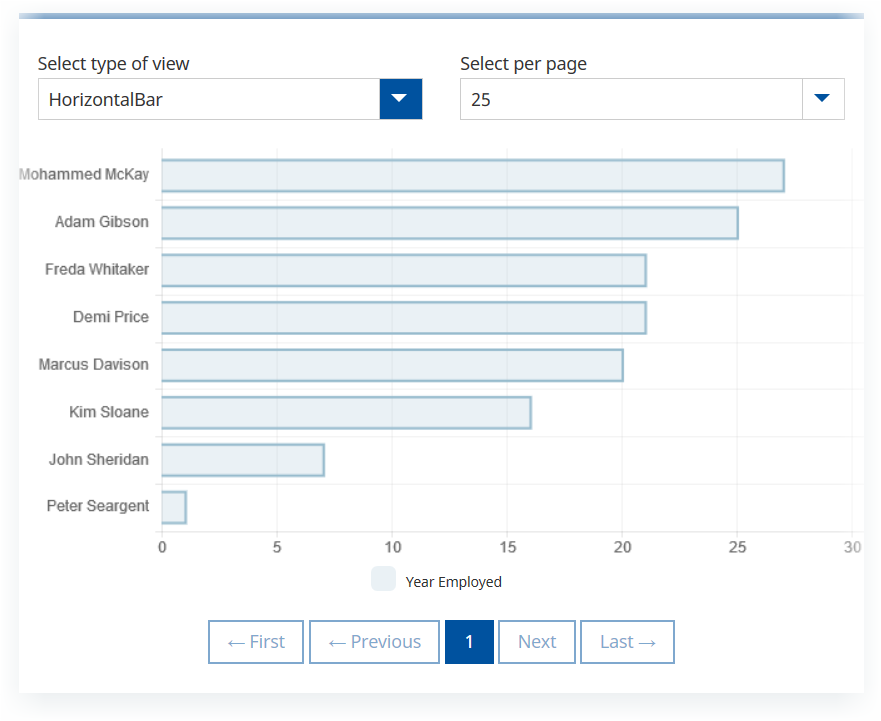
- The legend includes labels for all charted bar types.
- Select a label to toggle that bar on or off in the chart.
Pie Chart
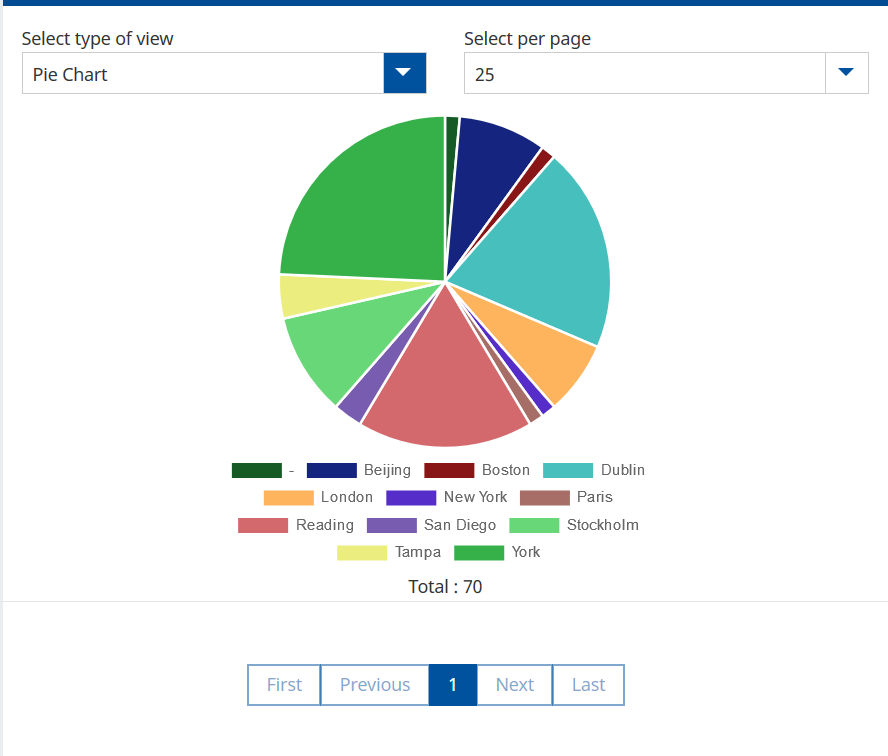
- Pie charts display data clockwise from 12 o'clock, in the order of the rows in Table display.
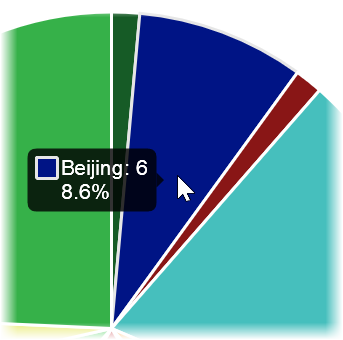
- Tool tips display the percentage represented by each segment to one decimal place:

- The legend includes labels for all segments of the pie.
- Select a label to toggle that segment on or off - any displayed total value alters to reflect the segments toggled on:

- Pie charts including the legend scale to fit the page size, so a large legend reduces the space available for the pie itself. Pie charts can display with up to 100 legend items.
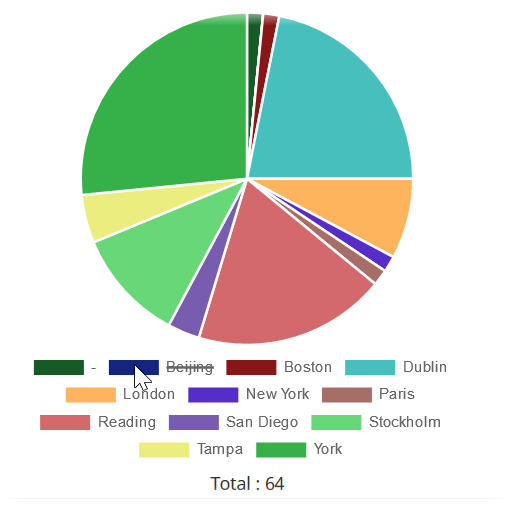
Note Pie charts are displayed using a standard color palette. This cannot be edited.
Doughnut Chart
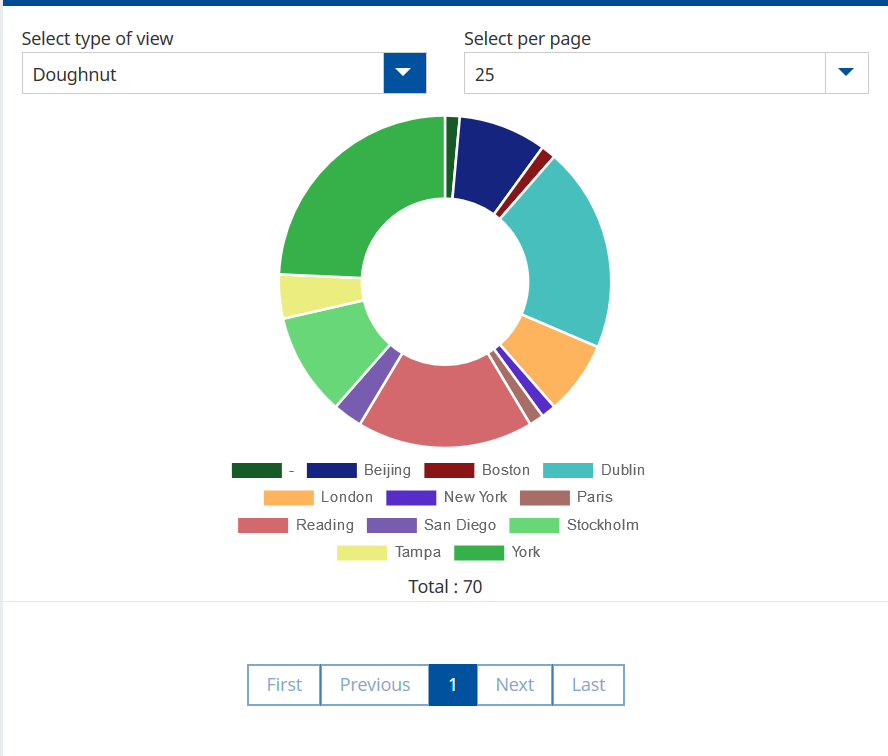
- Doughnut charts display data clockwise from 12 o'clock, in the order of the rows in Table display.
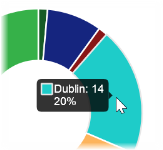
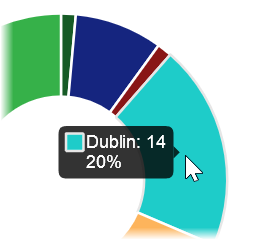
- Tool tips display the percentage represented by each section to one decimal place:
- The legend includes labels for all sections of the doughnut.
- Select a label to toggle that section on or off:
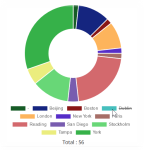
- Doughnut charts including the legend scale to fit the page size, so a large legend reduces the space available for the doughnut itself. Doughnut charts can display with up to 100 legend items.

Note Doughnut charts are displayed using a standard color palette. This cannot be edited.
Radar Chart
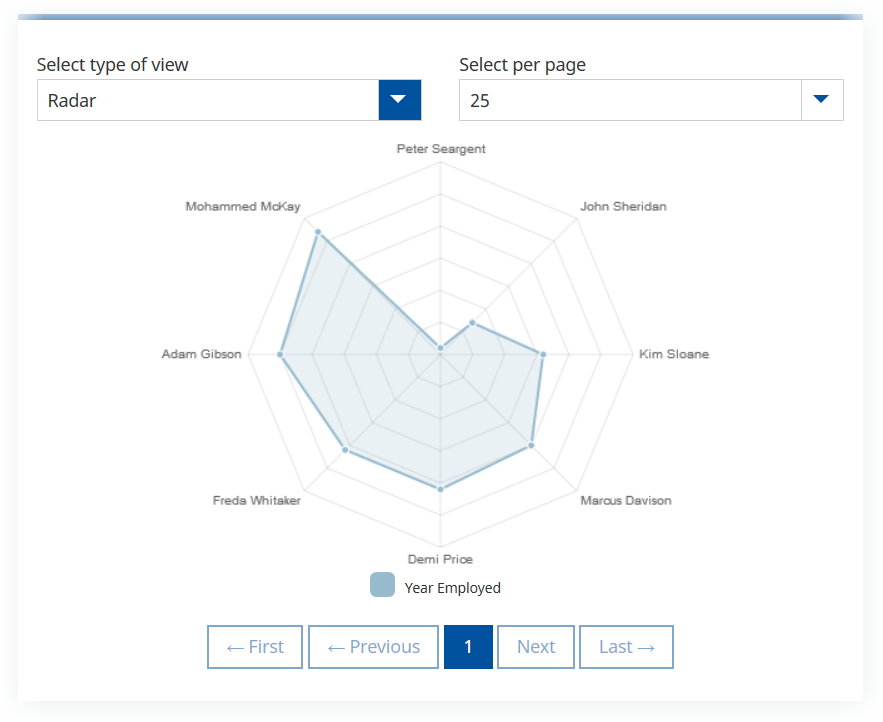
- The legend includes labels for all charted lines.
- Select a label to toggle that line on or off in the chart.