Understand how to use a Turnover Report by Month in Sage People.
Resolution
- With the Turnover Report on display, select By Month.
- Use the back
 and forwards
  scroll buttons to select the time period you want to display. The chart and data table remain 12 months wide.
 - The example uses data from February 2015 to January 2016.
- For each month in the display, the chart shows:
- A total headcount bar
- An annualized turnover rate line
Hover to display the data values:


For each month, the data table shows:
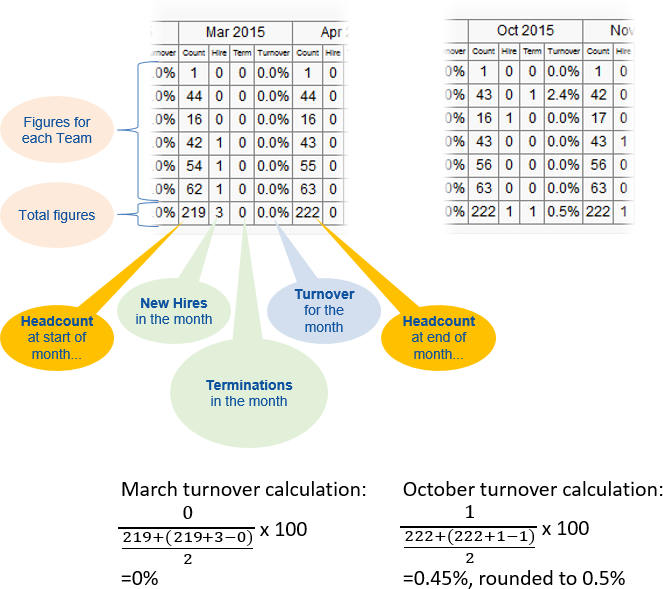
The chart doesn't show monthly turnover figures.
For the overall report, the data table shows figures for the whole period:
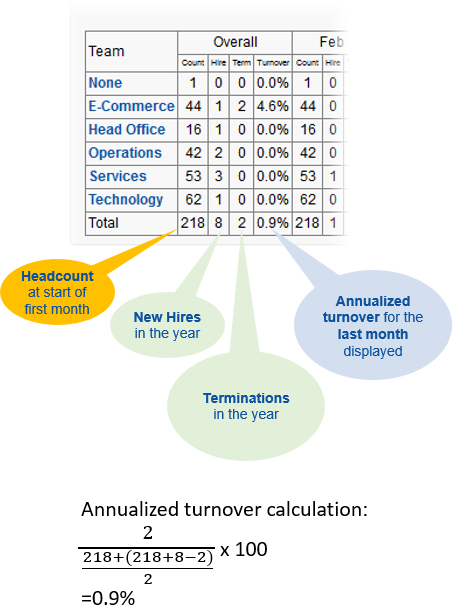
All annualized turnover data points on the line chart use the same calculation method:
-
Calculate the average headcount over the previous 12 months:
- Take the starting headcount 12 months ago
- Calculate the headcount at the end of the 12-month period. Add the total number of new hires and subtract the total number of terminations
- Add the starting headcount and the headcount at the end of the 12 months, and divide by 2
- Take the total number of terminations in the previous 12 months. Divide it by the average headcount over the previous 12 months.
- Multiply the result by 100 to convert it to a percentage.
When the system repeats this for each month through the year, the calculation produces a rolling, month-by-month series of annualized turnover figures.